Intro
ancoreShare Extension allows you to configure condition-based and flexible styling formats for your true-table object. You can specify colors, font styles and alignment for each column in the table and set conditions or Qlik Expressions to further define styles for specific cells.
- The style settings in the column style editor override the general Table settings specified in the properties panel.
- Styles within the column style editor are respected in order of precedence from top to bottom - last one rules.
- Checkboxes allow to NOT set a style and therefore preserve from the preceding settings.
For example, In style 1 if you have specified all sales totals under 5 Million should be filled with Red. After that, if you add a style 2 with the condition stating sales totals column should be filled in Green, then the table will respect style 2, and sales totals cells will be filled in Green even if the totals are less than 5 Million.
Now, let's see how you can work with column styling.
The following section will explain:
- Add Column Style
- Column Definition
- Header Style
- Body style
- Images in table cells
- Example of working with column styles
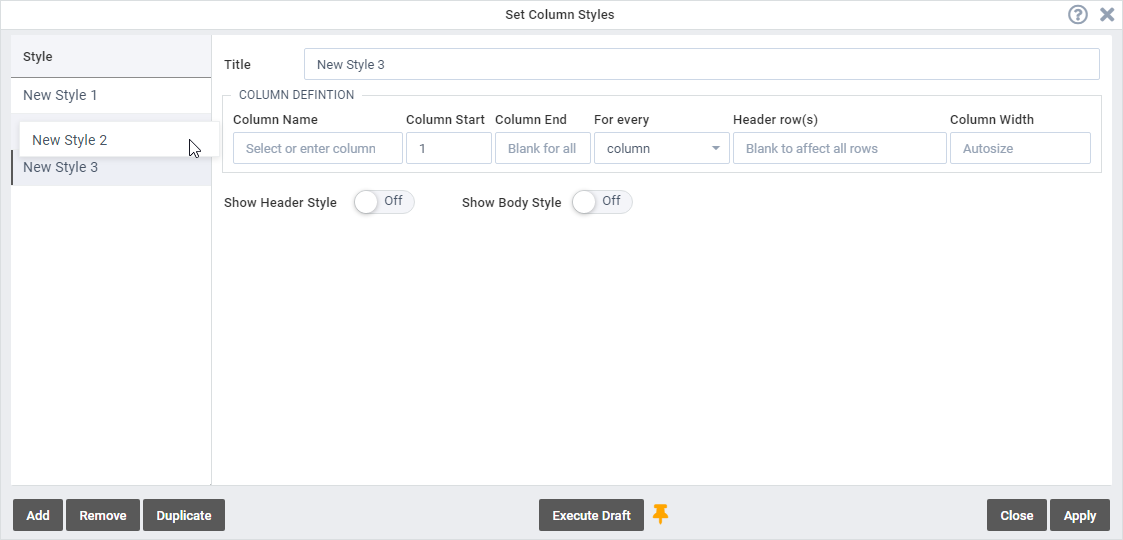
| To specify conditions that will govern the table headers, totals rows, or columns, click the Set Column Styles button in Table settings. This opens the Set Column Styles dialog box. | 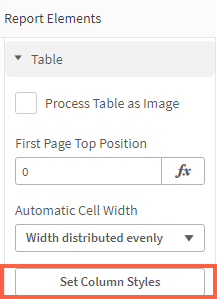 |
Add Column StyleTo access the editor and specify conditions that will govern the table headers, totals rows, or columns, click the Set Column Styles button in Table Settings.
Note The order of adding styles is important as the styles are respected in order of precedence. | |
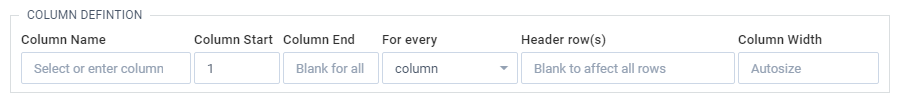
Column DefinitionSpecify the column(s) on which the added style should be applied. You can either go by column name for one column or by column number for one or more columns.
Column NameProvide the column name on which you want to apply the style. Alternatively, start the name with "=" to provide a Qlik expression. This enables you to also work with dynamic dimensions or to control the column for which you create this style, for example, with a Sense Variable input object. The column names are the same as those in your Sense App. If you provide a column name, the other fields for column numbers mentioned below are hidden, as you are defining the style for this particular column. Refer to the Qlik documentation to know more about expressions. Column Numbers | |
See the example on the right showing column numbers. | 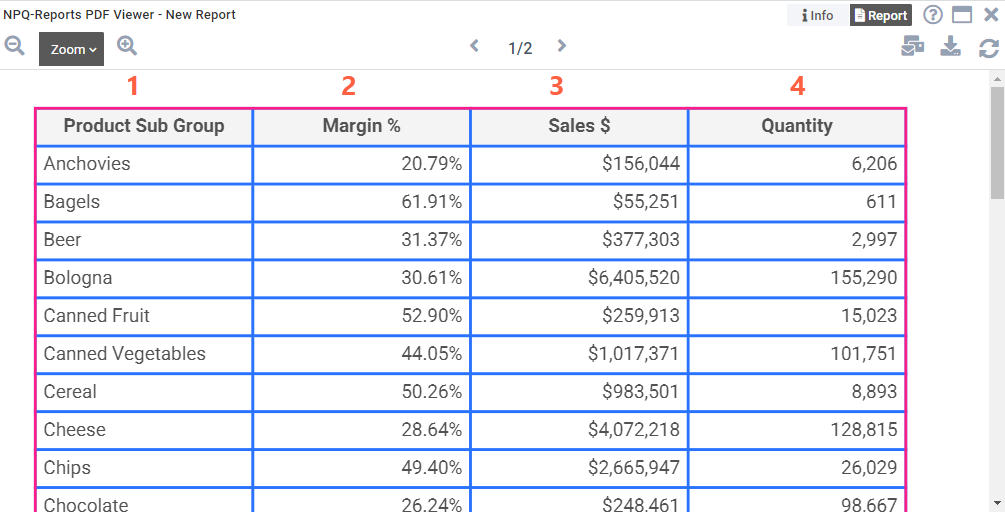 |
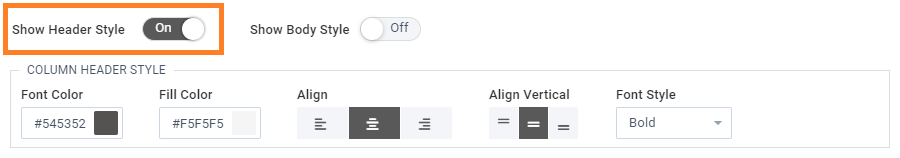
Column WidthUse this field to specify the column width. By default, the width is set to Autosize.If specified, the number is calculated in the Report Unit set in the Page Settings (default is mm). Header StyleTo define a style for headers, toggle to enable the Show header style option, and specify:
| |
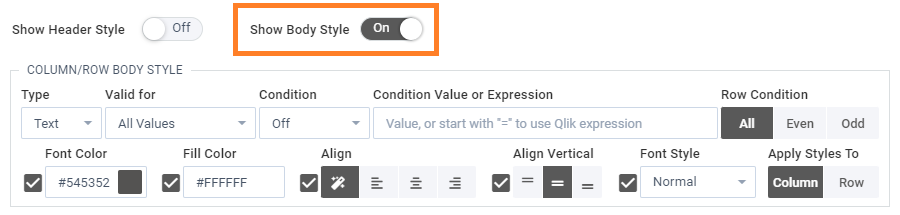
Body styleTo define a style for table cells, toggle to enable the Show body style option.
Specify rows
Set style
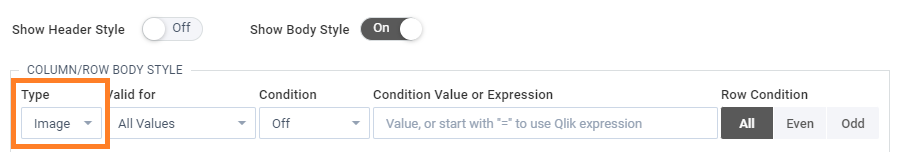
Tipp In case you have configured multiple styles, you can untick the checkbox corresponding to the properties that you want to be respected in the preceding styles. Once you are done with setting your styles, click Apply. Images in table cellsQlik Sense tables (as well as some other third-party table objects like Vizlib tables) allow to display images in cells, either from a file or via HTML image URL source. (Go to Qlik help to learn more.) To display the image values in ancoreShare as well, just set the cell Type to "Image" in the Body Style properties.
The ancoreShare report respects the same image properties as specified in your Sense table object. Adjust row height The specified minimum row height effects the image size.
ExampleLet us look at an example for styling headers and columns to understand how it works. For this, let us assume that the sales target was $50 Billion. | |
Step 1 - Set the first style: Let us first define a condition for the cells that meet the target. | Step 1:
|
Step 2 - Set the second style: Let us now define a condition for the cells that do not meet the target. Click the Add button to add another condition. | Step 2:
|
Result: Here's a sample report showing how the conditions are applied to different column cells. As you can see, all the cells where totals exceed $5 Billion are highlighted in Green, and the ones having less than $5 Billion are highlighted in Red. Similarly, you can define any style for your table. | Result: 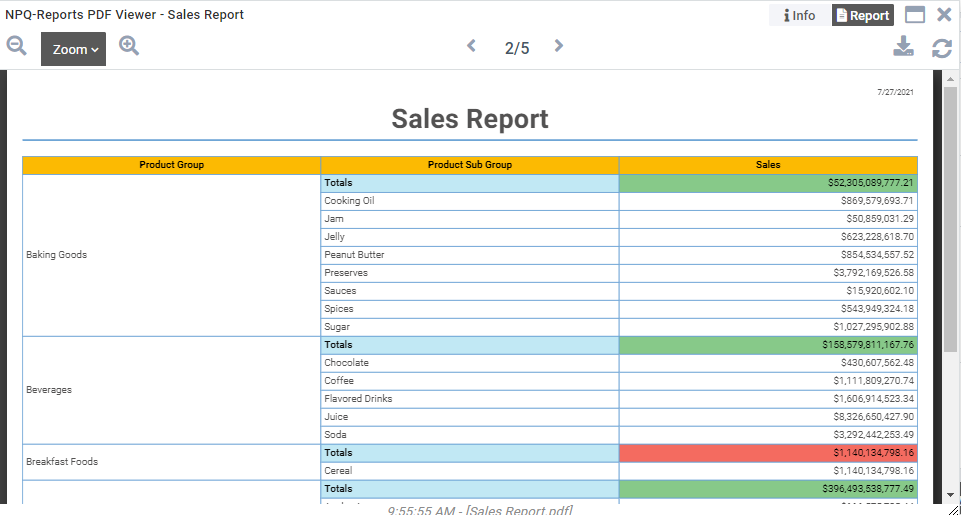 |


.png)
You can now proceed to add other elements to your report.
Next Steps:
- Now add Charts, Text, or Lines to your report
- Learn more about positioning all elements
- See a report draft in the preview window
- Or, share and export the report