Intro
This special element initiates a feature that allows you to select a Qlik Sense field for a cycle and then loop all other elements (charts, tables, etc.) within that cycle section for each data value of the Qlik field (dimension).
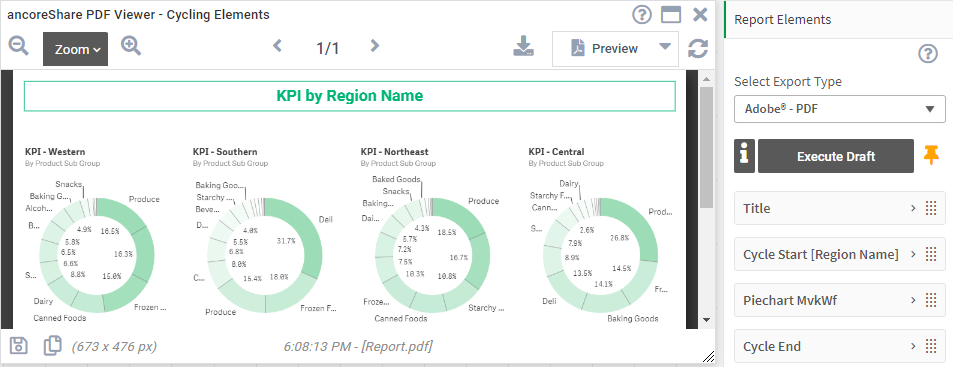
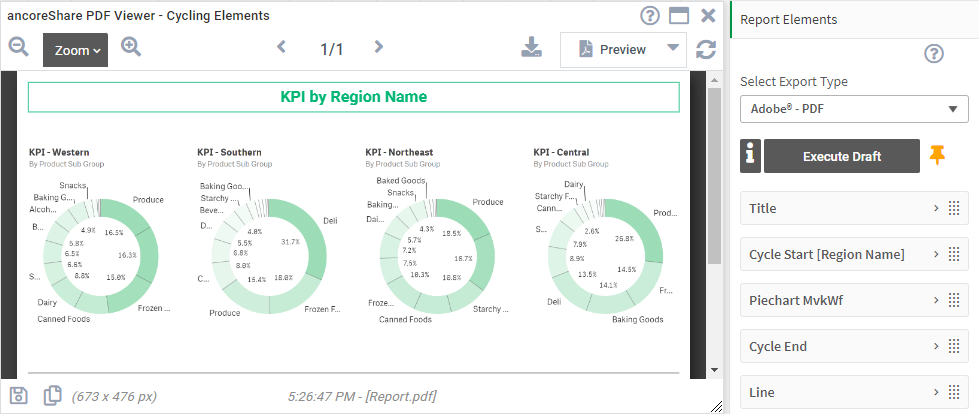
For example, this cycle contains one Chart object (a Pie Chart with a KPI value) and is looped for each of the four values of the field "Region Name":
The following sections explain:
- How to basically Create a Cycle and how to add elements
- How anchoring and Positioning works for elements within cycles
- And a section that explains all Basic Settings and the Element Properties of the cycle element
Creating a Cycle
At any point in your report, you can initiate a cycle by adding a Cycle Start element to your report design. Each element added after a Cycle Start will get looped for each value of the given dimension as Cycle Field (you can restrict it to a maximum number of loops). So the Cycle Start element itself is not visible on your report, in only functions as a starting point for the cycle section - and so does the Cycle End element. Theoretically you can add as many elements to the cycle area as you like, but keep in mind that they are multiplied. For example, if you loop a field with 4 values and add 3 elements to the cycle, then 12 elements will be rendered on your report. All elements within the cycle section will get repeated in a loop x times according to the x number of values in the Cycle Field Number of cycled field valuesCycling means, that all values in this field are single selected one after another and after each selection, all the elements within this cycle section are generated with this selection value, and then looped through repeatedly until the cycle ends. The values of the field are thereby reduced to any given selections in your current Qlik Sense session and limited by the Max Cycles setting. You can further sort the values of your Cycle Field. | 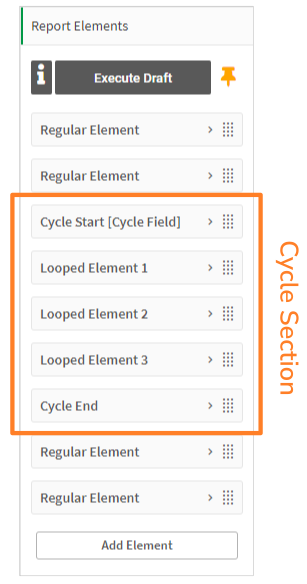 |
='KPI - ' & Concat(distinct [Region Name],'/')
Positioning Elements within a Cycle
To position all elements within a cycle section, you have to consider these four settings:
- The Anchor setting of the first looped element (charts, tables, etc.) within the cycle
- The Anchor setting of all the other looped elements (charts, tables, etc.) within the cycle
- The Anchor setting of the Cycle Start element
- The Cycles on new page setting in the Cycle Start element
In general, the Anchor defines the relative position of elements on the report page to a certain preceding element.
Here are the specifics when it comes to cycling:
1 - Anchor of the first looped element
This one is relative to the last element before the Cycle Start element in the report.
In Example 1 it is relative to the Title element, which comes before the Cycle Start element.
2 - Anchor of all other looped elements
These are relative to their actual preceding element, just like without a cycle.
They determine the position of elements relatively to each other within a loop of the cycle, like they create a whole report page in Example 4.
3 - Anchor of the Cycle Start element
This one applies to where the first element (chart, table, etc.) within the cycling section should be anchored in respect to the last element of the cycle, so it takes effect beginning with the second loop and determines where the next loop starts (and further loops respectively). It is the anchoring link between the loops of a cycle.
4 - Cycles on new page setting
This one also applies to the first element (chart, table, etc.) within the cycling section beginning with the second loop, and decides whether a new loop begins on a new page.
EXAMPLES:
The following Example 1 and Example 2 explain possible combinations of those settings with the same initial report example, where the report consists of 1 Title (a text element serving as preceding element), then 1 Cycle Start and 2 text elements to be looped. As there comes no other element after the cycle section, there is no need to add a Cycle End element. In this example the Cycle Field contains 2 values: "Drink" and "Food". | 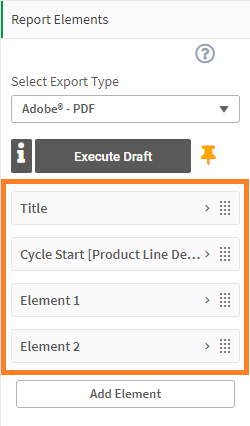 |
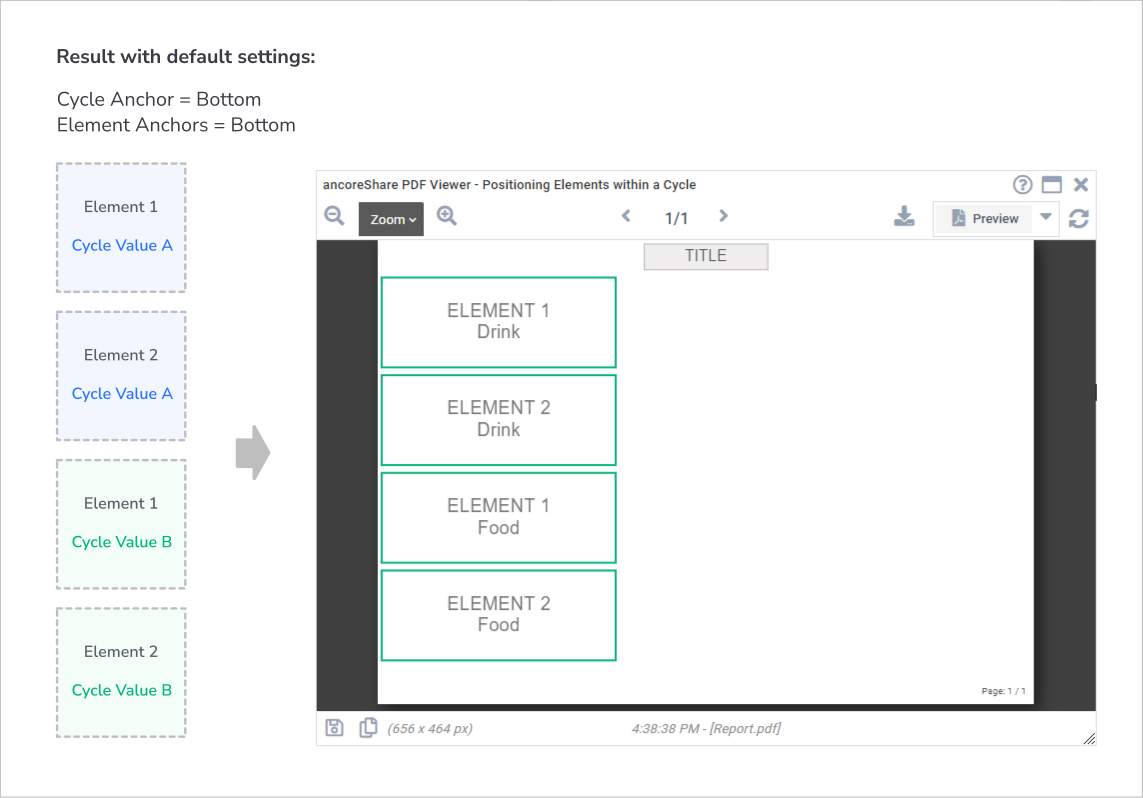
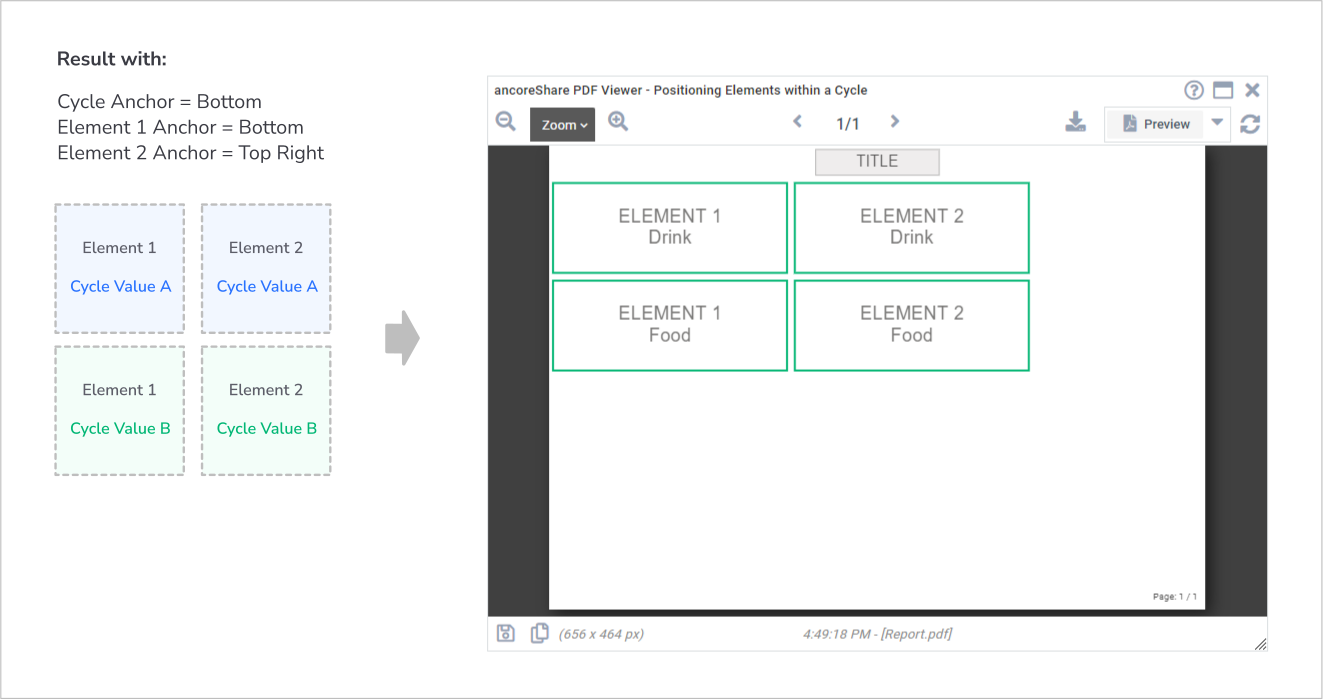
Example 1
By default all anchor setting in the Cycle Start element as well as in all looped elements is set to "Bottom", and "Cycles on new page" is disabled, which results in all looped elements being placed just one below another.
The Anchor setting of ...
- ... the Cycle Start element applies to the relative position of the first element in a new loop to the last element of the previous loop. Or to be specific of "Element 1 Food" (Cycle Value B) to "Element 2 Drink" (Cycle Value A).
- ... Element 1 is relative to the Title element.
- ... Element 2 is always relative to Element 1 in every loop.
Would the Cycles on new page setting be enabled, "Element 1 Food" (so the second loop) would begin on a new page, and each further looped Element 1 as well.
Example 2
By simply changing the Anchor setting of Element 2 in the report to "Top Right", the elements within a loop are placed next to each other instead of below each other.
And again, would the Cycles on new page setting be enabled, "Element 1 Food" (so the second loop) would begin on a new page, and each further looped Element 1 as well.
Example 3
This example only consists of 1 looped element within the cycle, a Pie Chart. The positioning result is achieved by setting the Cycle Start Anchor to "Top Right".
='KPI - ' & Concat(distinct [Region Name],'/')
Example 4
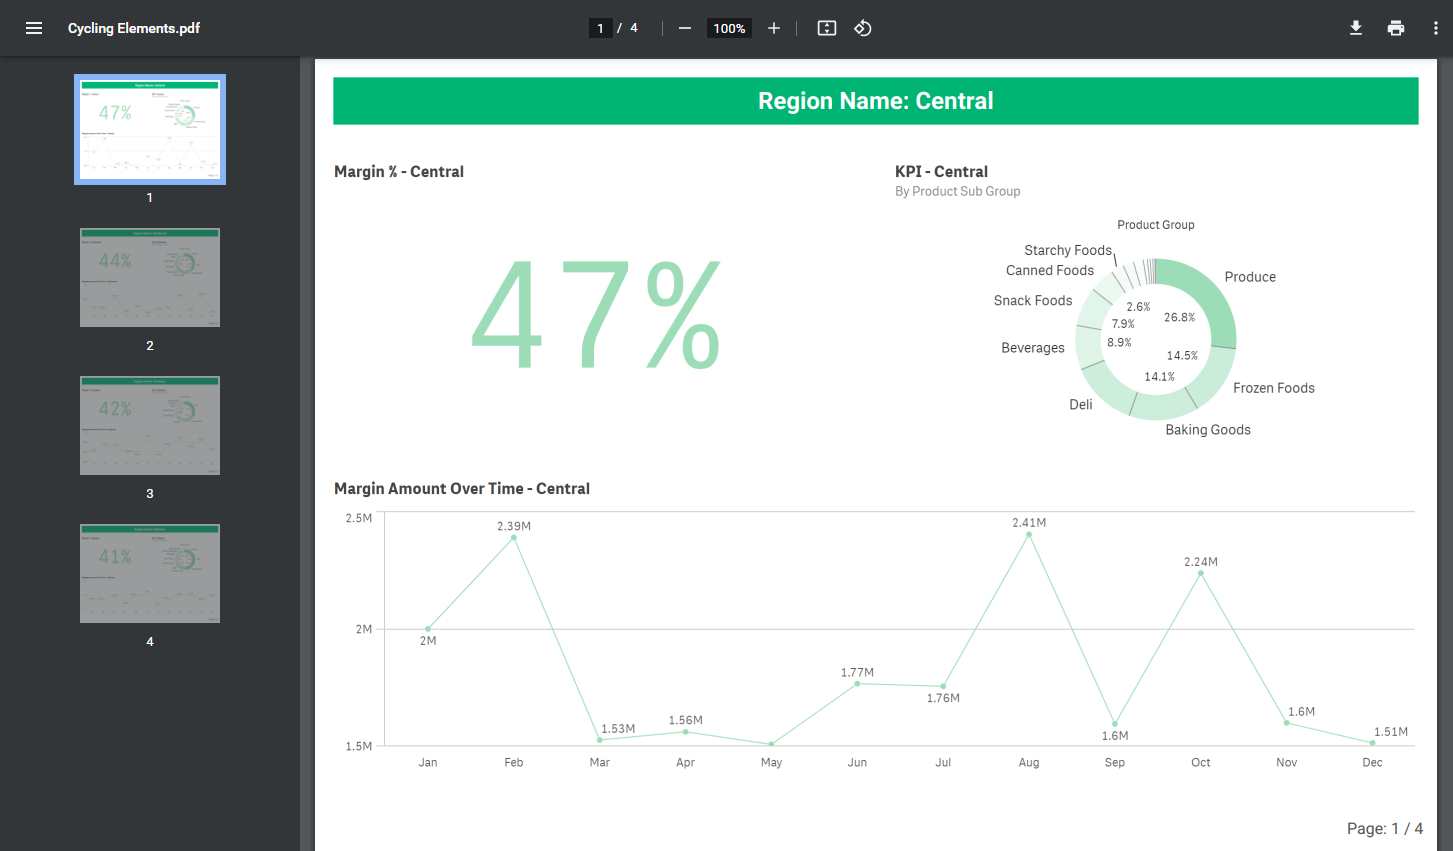
The following example shows a report with a cycle looping four elements, which create a whole report page:
- First a text element naming the Cycle Field value as a title
- Below a KPI object
- Right next to it a Pie Chart (anchor setting of this element is "Top Right")
- And below a Line Chart
The Cycle Field is "Region Name" and contains four values: Central, Northeast, Southern, and Western which are sorted in an alphabetical ascending order.
In this example the setting Cycles on new page is enabled in the Cycle Start element, which results to each loop being placed on a new page in the PDF export.
Thus, this PDF report shows 4 pages with the same elements, but each page is automatically cycled with a different dimension value.
='KPI - ' & Concat(distinct [Region Name],'/')
Basic Settings
Here begins the description of all available settings for a Cycle Start and thereafter a Cycle End element.
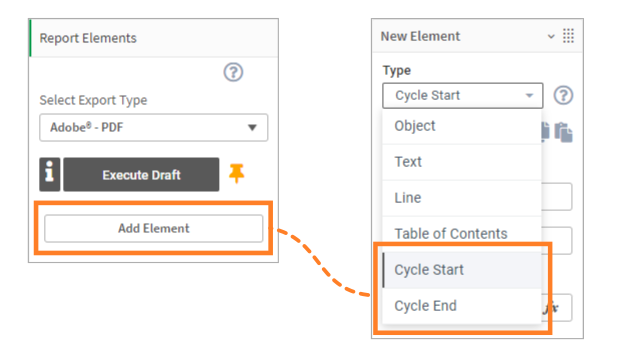
Start by adding a Cycle Start element and set general element properties.
Add Cycle Start
- On your Sense sheet, select the ancoreShare button to which you want to add the element.
- On the properties panel, click Report Elements > Add Element.
- Click on Type and select Table of Contents from the dropdown list.
NOTE: The Add Element button is always available at the bottom of the properties panel. For multiple elements, please scroll down to see the button.
CaptionWhen you add a Cycle Start element, the caption is at first automatically just populated as Cycle Start, and after setting a Cycle Field it is extended by that field, for example as "Cycle Start [Region Name]" like in the screenshot on the right. You can rename this field to provide a meaningful caption that will help you in navigating through your report elements. | 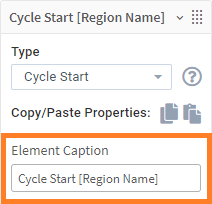 |
Cycle FieldThis is where you set the data - choose a Qlik Sense field (dimension) from your app. | 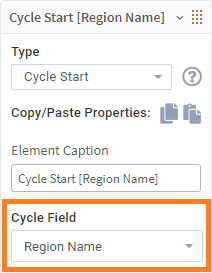 |
Max CyclesThis setting restricts the number of loops when cycling. The field allows to set this property dynamically with expressions too, but make sure your result is numeric. By default it's set to a maximum of 5 loops in the cycle, which means that each element (charts, tables, etc.) within the cycle would not be looped and placed on the report page more than 5 times, even if the Cycle Field contains more than 5 values at the time of execution. There's also a hard limit in the system which is 2000 cycles. | 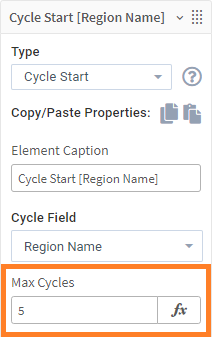 |
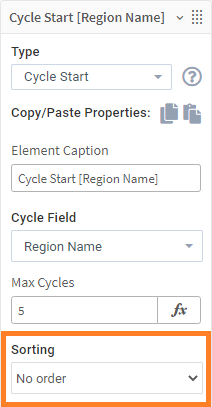
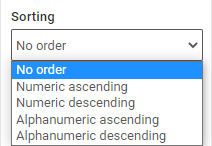
SortingYou can sort your Cycle Field values in a numeric or alphanumeric order, either ascending or descending, or with no sorting at all (default). If the number of Max Cycles is lower than your actual dimension values, the first ones will be looped according to your sorted order.
|  |
Cycles on new pageYou can choose to begin each loop of your cycle on a new page. If you have just one element (chart, table, etc.) in your cycle, this means that for each of your cycle loops (dimension values) the cycled element is put on a new page. And if you have more than one element in your report, each time the loop goes back to begin again with the first element within your cycle for the next dimension value, it starts on a new page. Read the section Positioning Elements within a Cycle to learn more and see examples. | 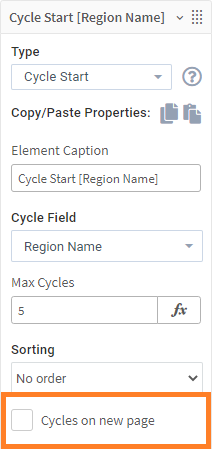 |
Calculation conditionIn the Calculation Condition field, click fx to open the expression editor. Specify an expression to set a condition that needs to be fulfilled (true) for the Cycle Start or Cycle End element to be enabled and considered when generating the report. It works just like the Activation Condition but is specific to each report element. Refer to the Qlik documentation to know more about expressions. | 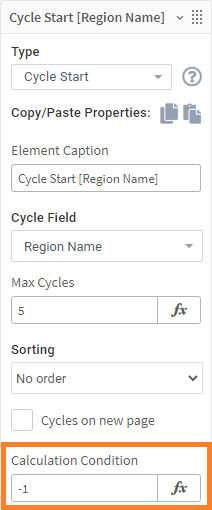 |
Element Properties | |
AnchorThe Anchor setting of a Cycle Start element applies to where the first element (chart, table, etc.) within the cycling section should be anchored in respect to the last element of the cycle, so it takes effect after the first loop, when the cycle returns back to the first cycled element. In general the Anchor defines the relative position of elements on the report page. Read the section Positioning Elements within a Cycle to learn more and see examples. | 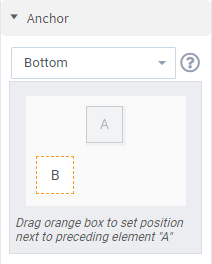 |
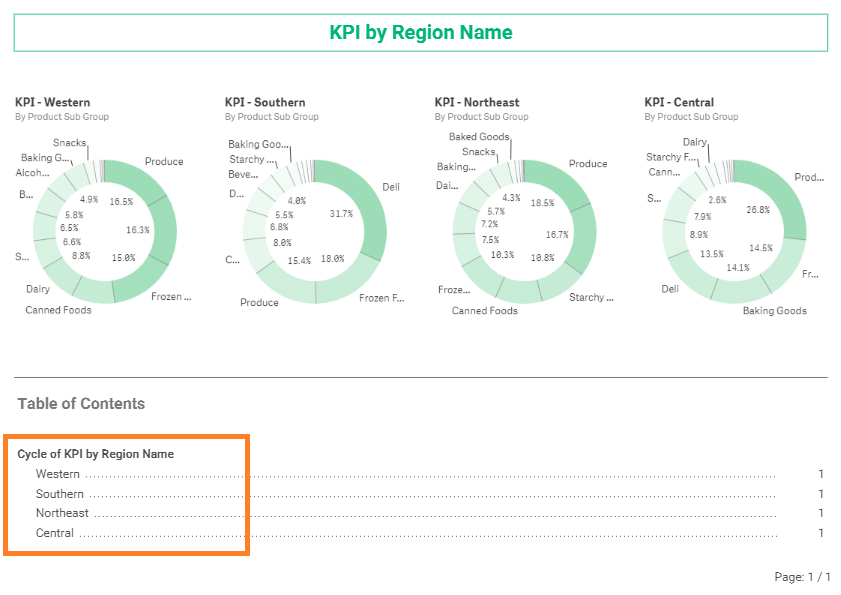
TOC Table of ContentsIf you added a TOC element to your report, you can choose for each other element, if it should appear in the table of contents or not. This might be useful to disable headers or paragraphs. You might also go for only enabling the header in the TOC instead of each object. The Cycle Start element can also be shown in the TOC and thereby for example function as a section header for the looped elements in the cycle - this can all be reflected in the TOC. This means, all the other elements (charts, tables, etc.) within your cycle can be shown in the TOC as well. When enabled (default), each looped element will be shown individually in the list, for example like this:
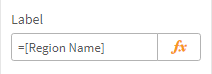
The Label of all the other elements (charts, tables, etc.) within your cycle are by default populated with the Cycle Field, for example like this:
| |
The following settings are available in the TOC section:
Tip Give all the other elements (charts, tables, etc.) within your cycle a higher indent setting than your Cycle Start element, to show the whole cycle as a section in your TOC. | 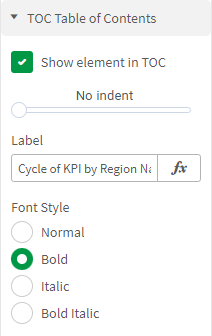 |
Cycle EndThere are three options to mark the end of a cycle in your list of report elements:
| |
Cycle End Element PropertiesThe Cycle End element has only one function and one setting. It marks the point where the cycle stops in your list of report elements, to determine which of the other elements (charts, tables, etc.) belong in the cycle range and which are outside of the cycle. You can also rename the Element Caption to provide a meaningful caption that will help you in navigating through your report elements. If no other regular element comes after the cycle section or you begin a new cycle by adding a Cycle Start element, it is not required to add a Cycle End element. | 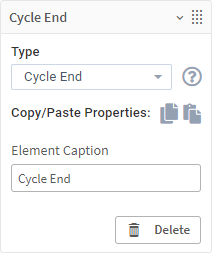 |
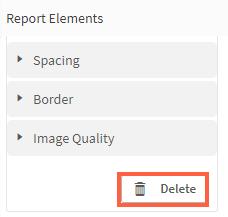
Deleting ElementsAt any time, you can click the Delete button to delete the cycle elements. | |
 | .png) |
Deleting just the Cycle End element only removes the indicator where the cycle stops, meaning all following elements would also fall into the cycle range.
Next Steps:
- Learn more about positioning all elements
- See a report draft in the preview window
- Or, share and export the report