Intro
ancoreShare integrates into your Qlik app sheet as a button. It comes with user-friendly properties that allow quick creating, designing, positioning, previewing, generating, and sharing of your reports. This section explains how to navigate through the various properties available with ancoreShare and gives you some essential orientation.
The basic flow for working with ancoreShare is as follows: Designing Reports (Report Elements, Report & Page, and Export Formats) Sharing Reports (Deployment) About ancoreShare (Version, Report Consumption, License Information, ...) | 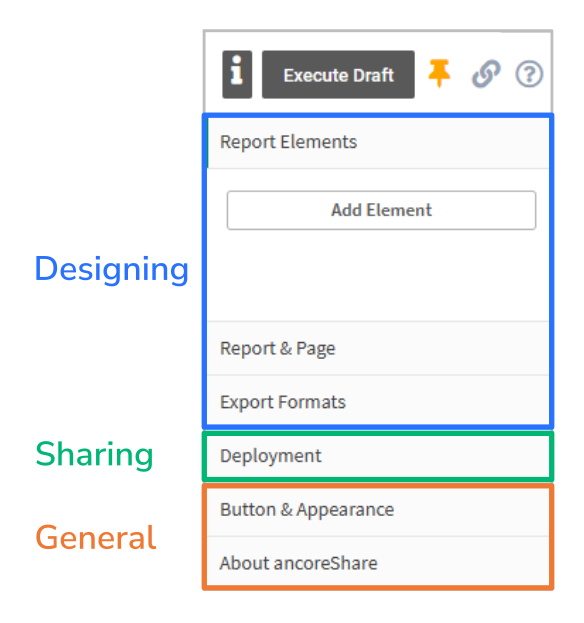 |
Accessing ancoreShare Properties | |
To view the properties for your ancoreShare object, perform the following steps:
The properties panel displays ancoreShare properties, as shown in the image. | 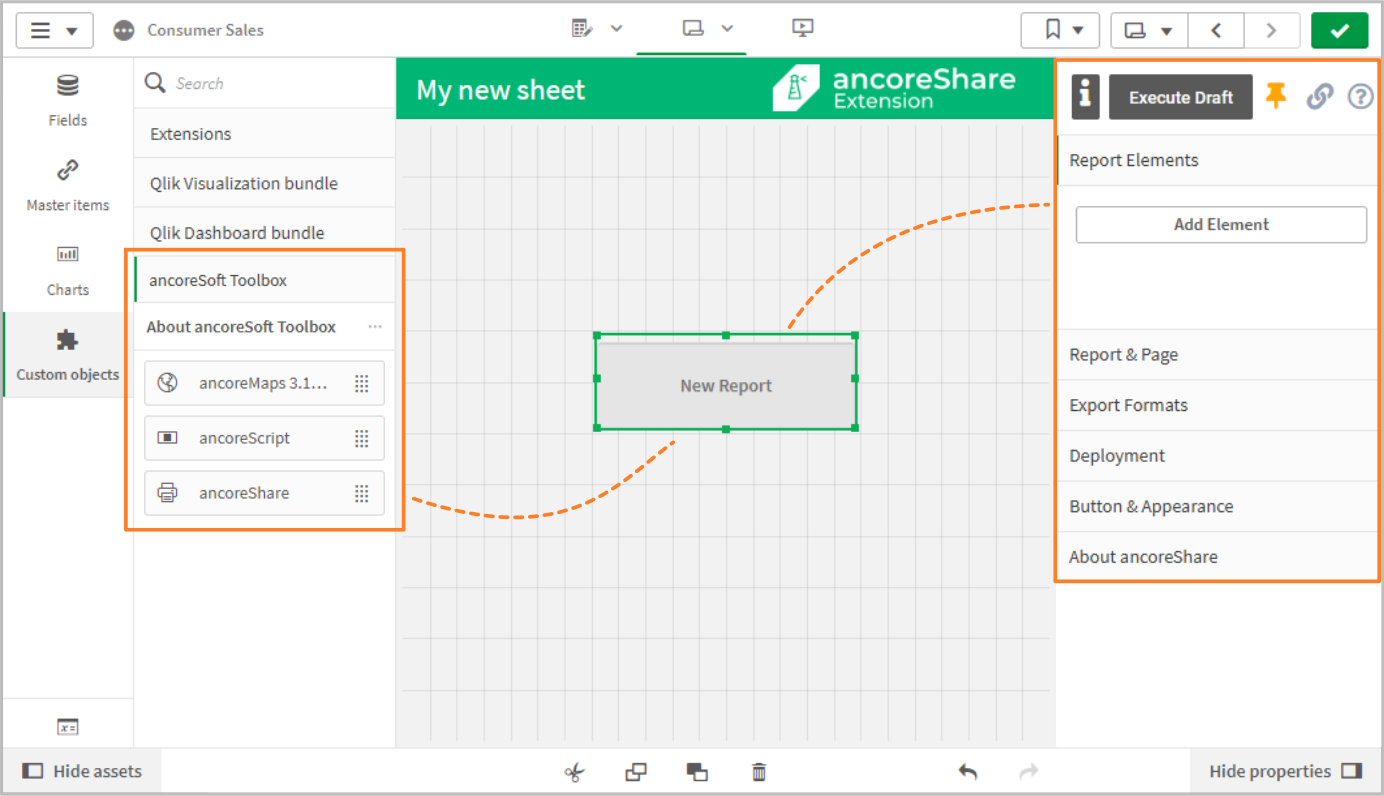 |
Menu Segments
This section provides an overview of menu segments available for customizing your ancoreShare reports. See the corresponding topic to learn more about these settings and learn how to use them for your reports.
Action BarThe top bar of the ancoreShare properties panel in Qlik Edit Mode contains the following action buttons: Info Report (i) Clicking the info icon "i" opens the Preview Window, displaying the Info Report with metadata about the current report design, such as page details, element information, and formatting. This provides a quick overview of the report's structure and setup and potential design errors. Execute Draft This button allows you to generate a draft version of your report while in Edit Mode. The report will use reduced image quality to speed up the process, making it easier to preview and adjust before finalizing. See more in the Generating Reports section. Pin Clicking the Pin button opens the Preview Window, a crucial tool for composing and designing your report. The Preview Window allows you to see real-time updates of your report, ensuring that the layout, visual elements, and content meet your expectations as you work on the design. It plays a fundamental role in fine-tuning your report, giving you the ability to make adjustments while viewing the report exactly as it will appear. Learn more in the Preview Window section. Link (Qlik Cloud only) Available in Qlik Cloud, this button opens a window where you can generate a link to remotely execute the report. This is useful for external scheduling, automated workflows, or giving access to users outside your Qlik App. For further details, visit Remote Execution in Qlik Cloud. Help The Help button takes you to this online documentation, offering detailed guidance on using ancoreShare’s features and troubleshooting tips. | 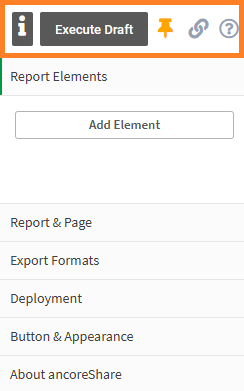 |
Designing ReportsReport ElementsThis section allows you to create the content of the report. You can add Qlik Sense objects or whole sheets, text, lines, a TOC or a cycle/loop, and other design elements to structure and compose your report. For more information on how to work with these settings, see the Designing Reports section. Report and PageThis section contains the general settings for the report. Here, you can configure background execution, define an activation condition, manage security settings, and set page details such as size, format, and page numbers. Export FormatsThis section includes various settings for configuring output formats and file types for your reports, such as PDF, PowerPoint, Excel, and CSV. You can specify the file name, add metadata like author or company, adjust PDF security settings, upload templates for Excel exports, and define the CSV field separator. | 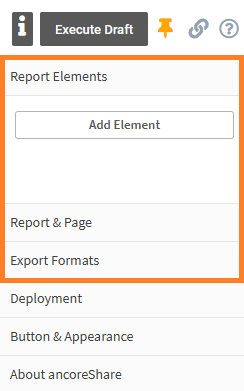 |
Sharing ReportsDeploymentThis section focuses on where your report will be delivered after execution. Options include downloading the report, using Qlik Application Automations or Microsoft Power Automate, configuring data export settings, or choosing deployment destinations like Email, WhatsApp, Dropbox, the ancoreShare Store, or creating custom exports via JavaScript. For more information, see the Sharing Reports - Export Settings section. | 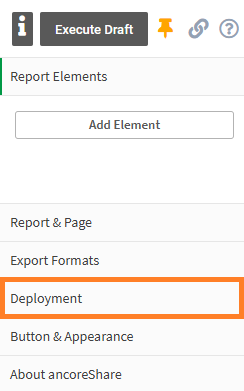 |
General Settings | |
Button and AppearanceThe options here allow you to configure the appearance of your ancoreShare button on the Sense sheet. You can specify the color of the button, or provide a caption and tooltip for each button. Here you will also find the Qlik Sense default properties panel segments General and Alternate states. See the Button and Appearancesection to learn more about how to work with these settings. | 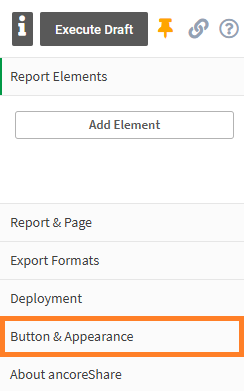 |
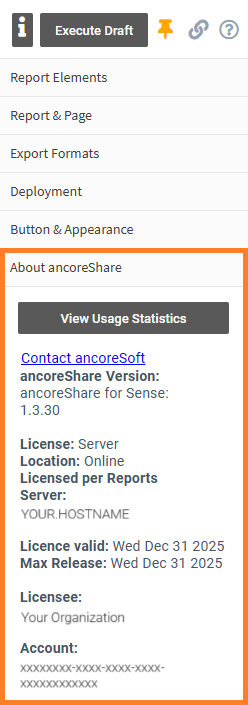
About ancoreShareThe About section provides the following information:
|  |
View Usage StatisticsThe View Usage Statistics feature provides detailed insights into report execution metrics based on different categories. After clicking View Usage Statistics, a window will open with four tabs, each displaying report execution data split by month and totaling per year. Note Only reports executed in analytics mode are counted; drafts and previews run from edit mode are not included. | 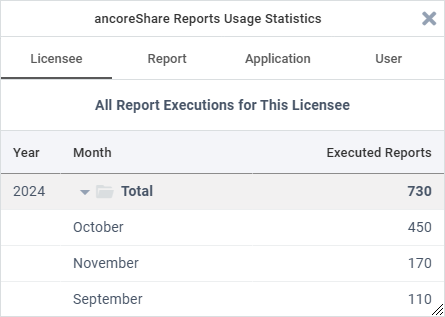 |
Here’s a breakdown of each tab:
- Licensee: Shows all report executions for your organization (the licensee). This tab displays the total number of executions across all reports associated with your organization. This count is particularly important, as most licenses are based on the total number of report executions per year.
- Report: Displays how often the current report has been executed, providing specific insights into its usage.
- Application: Shows the number of executions for all ancoreShare reports within the current Qlik application. This is helpful for understanding the overall report activity within a specific app.
- User: Displays the execution count for the user currently viewing the statistics. This includes all report executions across all reports and applications associated with the organization’s license but is filtered to show only those executed by this user.
Each tab provides a month-by-month breakdown, with yearly totals displayed to give an overview of usage trends.
Next Step:
- Start configuring your ancoreShare Button
- Or go to designing your reports