Intro
The preview window is one of the most important tools of ancoreShare Extension that you will use while designing a report.
As the name suggests, this window shows a preview/draft of your PDF report. Additionally, you can also view details about all the elements in the report and their properties when you are in Sense edit mode. It has three different viewing modes you can choose from.
For performance purposes, the window only shows an image preview when the export file type is set to PDF. If you generate a PPTX file, it will be directly downloaded to your device, and you will need an MS Office PowerPoint application to open and view it. This also means if you have Links or Notes added to your elements, they will not be clickable or visible in the preview window. It is recommended to download a draft of your report to verify the correct redirection of links and placement of notes.
Accessing preview window
To access the preview window, perform the following steps.
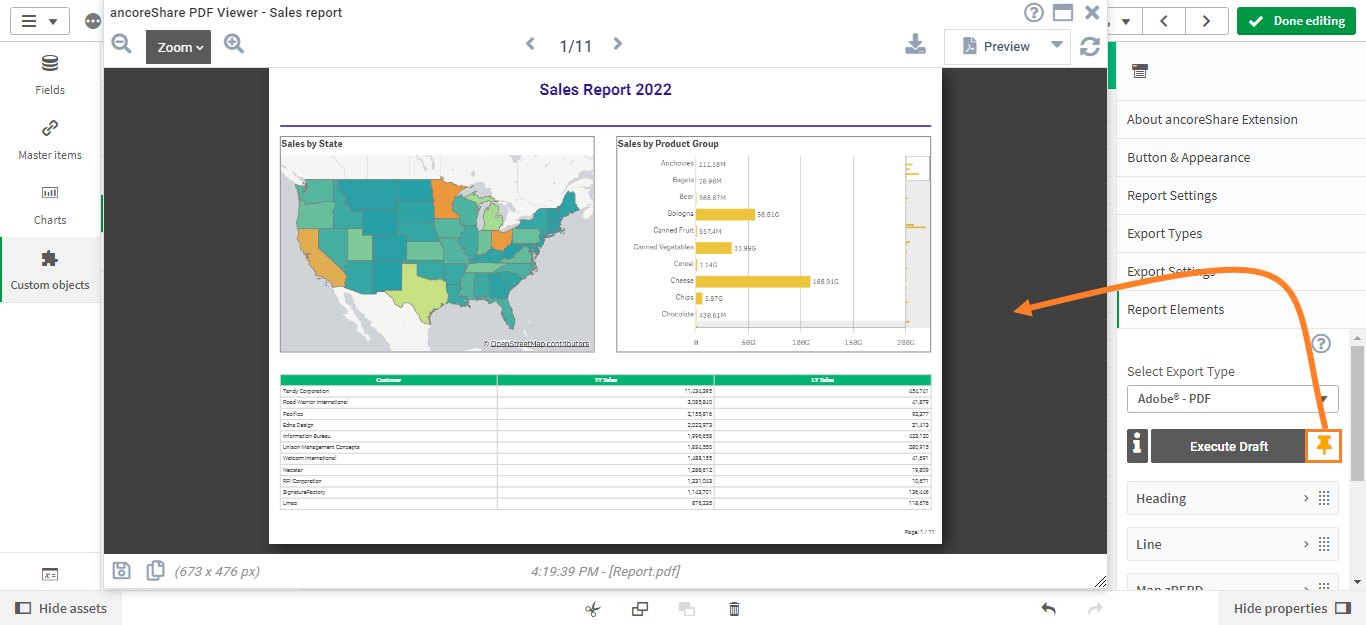
- On your Sense sheet, select the ancoreShare button for which you want to view a draft in the preview window.
- On the properties panel, click Report Elements.
- Here, click the pin icon. This opens the Preview window as a pop-up on your screen.
NOTE: The Preview window is an instance in itself.
This means once it is open, you can populate it from every ancoreShare button by just clicking on the button, or in edit mode, refresh the preview with the icon in the top right corner.
You can position the window wherever you want and resize it by grabbing the bottom right corner of the window. You can also use the console button on the top right to maximize the preview window, which covers your Sense sheet to maximize the view.
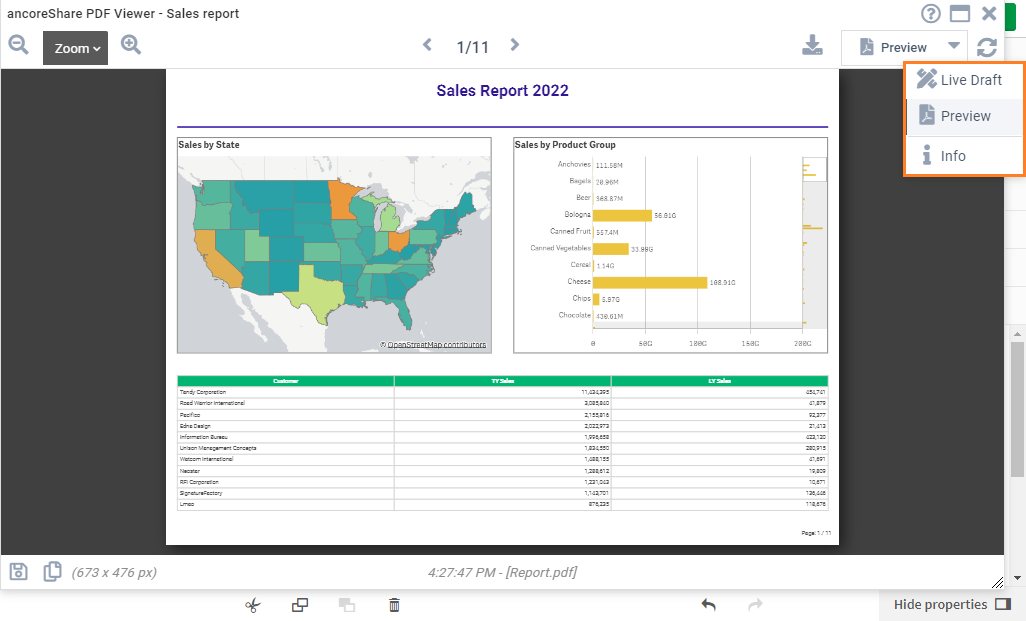
View modes
As you can see in the image below, the Preview window has three modes:
- Live Draft: Shows live view of elements immediately as you make changes. Charts are represented by placeholders, and tables are limited to 10 rows.
- Preview: Shows the actual report design with lower quality (96 dpi) chart images and full data-driven tables.
- Info: Shows all the settings and elements added to the report.
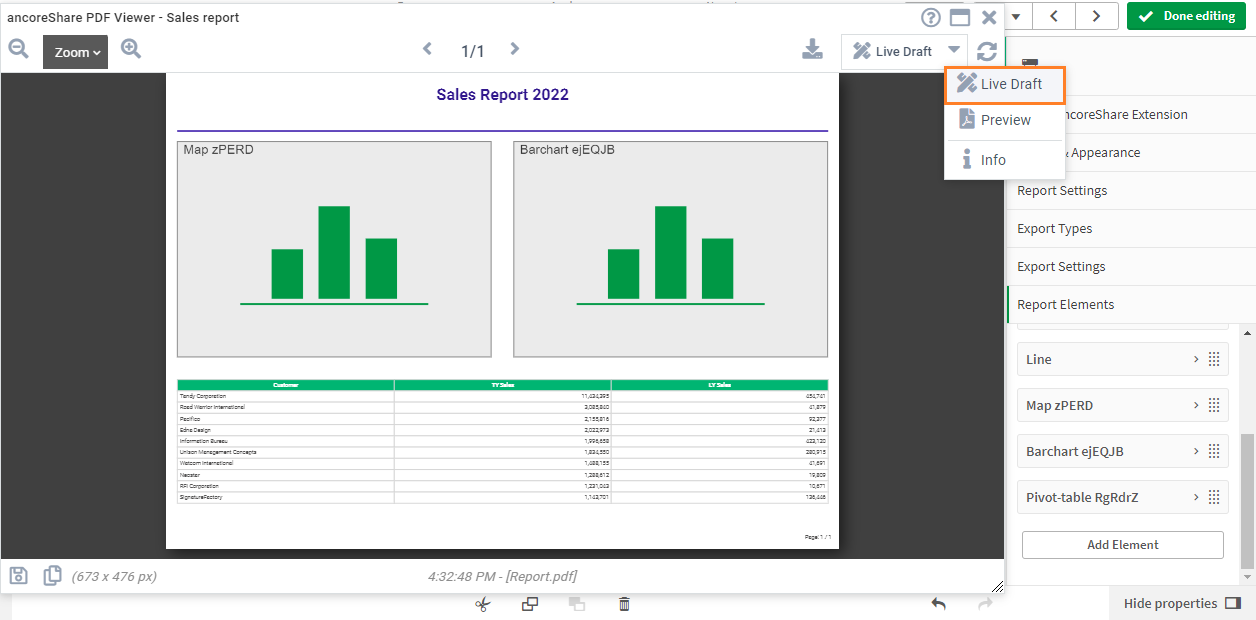
Live Draft
The Live Draft mode shows a live view of how the elements will be placed on your PDF report. This is particularly useful while you are designing a report, as you can simultaneously see how the report will look. The design is updated on the live draft as soon as you make any changes on the properties panel.
As this is a very fast method of seeing report previews, the tables are limited to 10 rows only, and charts are represented by placeholder images. To see the actual charts and tables, use the Preview mode. To trigger the first reload of your report after switching to Live Draft mode, click the Refresh icon or just make a change to the design of your elements from the properties panel.
Here's an example showing how the report design is displayed in the Live Draft mode:
We recommend reading the Report Elements section to understand how to place Sense objects and other elements in your report.
Preview
The Preview tab shows how your PDF report looks. In this mode, the report is generated instantly, and actual charts, tables, and other elements are shown on the report.
This is because the images are rendered in fast mode while editing to save time when generating the report. To see the report with higher quality chart objects, click Done editing from the top-right of your Sense sheet, and click the Refresh button on the preview window.
Here's an example showing how the report design is displayed in the Preview mode:
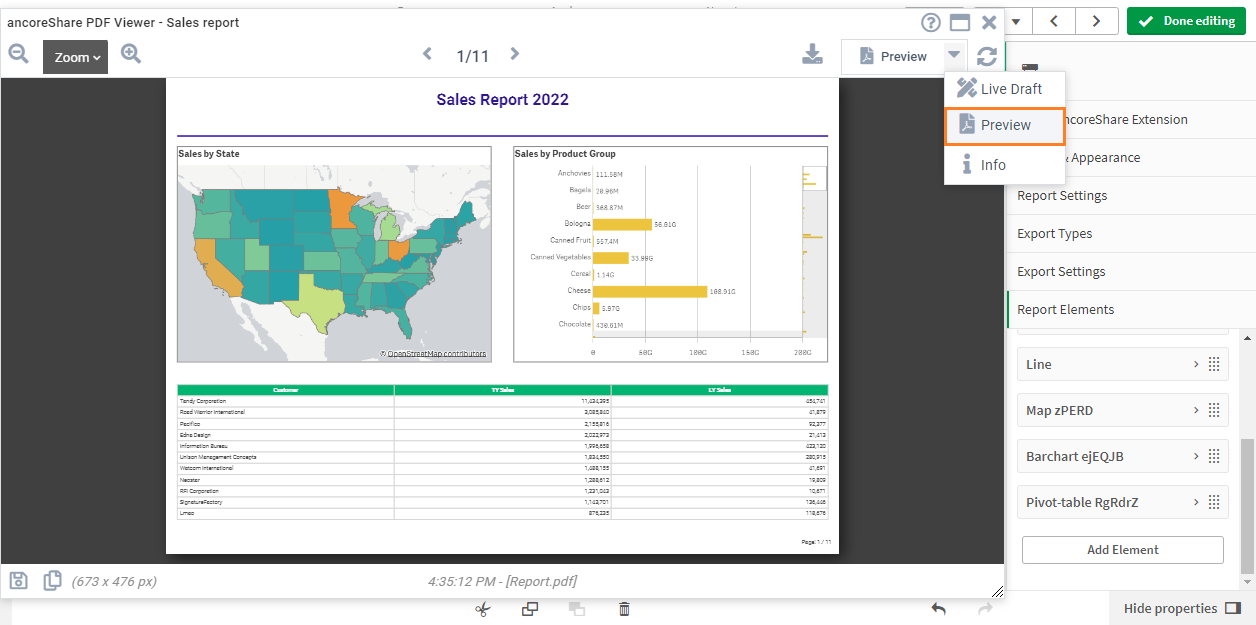
At any time, if you make any changes to the report design, you can click the Refresh icon to see how it affects the report design.
We recommend reading the Report Elements section to understand how to place Sense objects and other elements in your report.
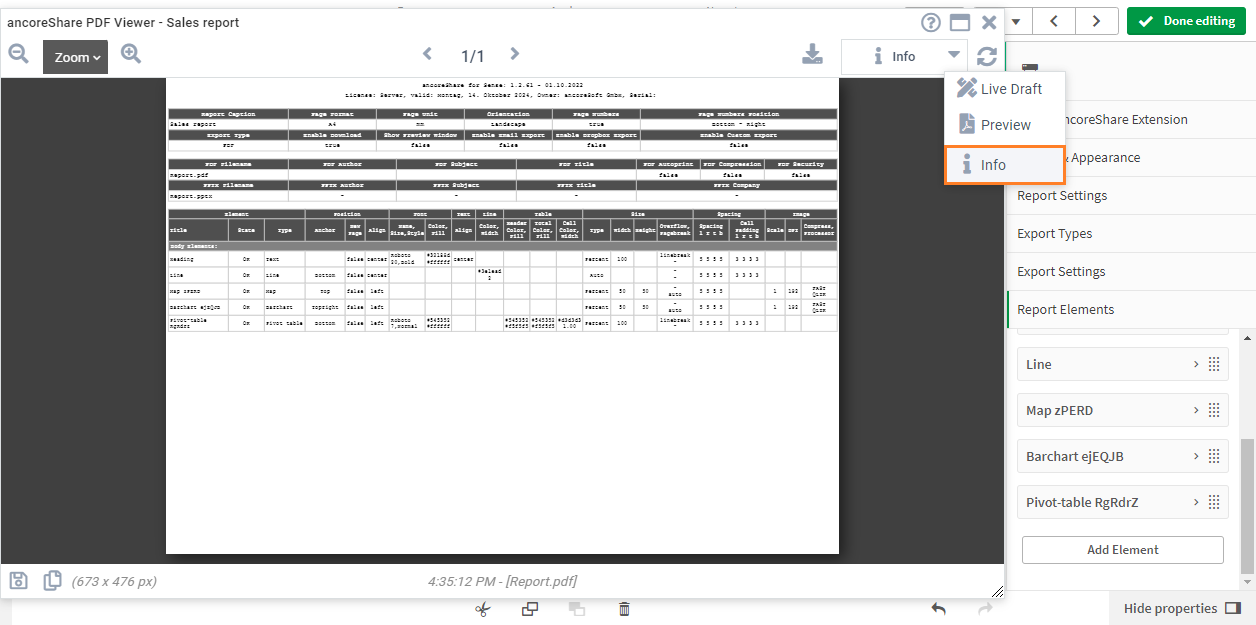
Info
The Info tab shows details of all the settings and elements added to your report.
It shows the information on size, captions, fonts, positions, anchor positions, margins, padding, etc., used in your report design.
Besides this, the State column displays if the element is placed correctly. In case of any errors or conflicts in your design, the State column is highlighted in Orange so that you can change your element properties accordingly.
We recommend reading the Report Elements section to understand how to place Sense objects and other elements in your report.
Here's an example showing the report information displayed in the Info mode.
Export
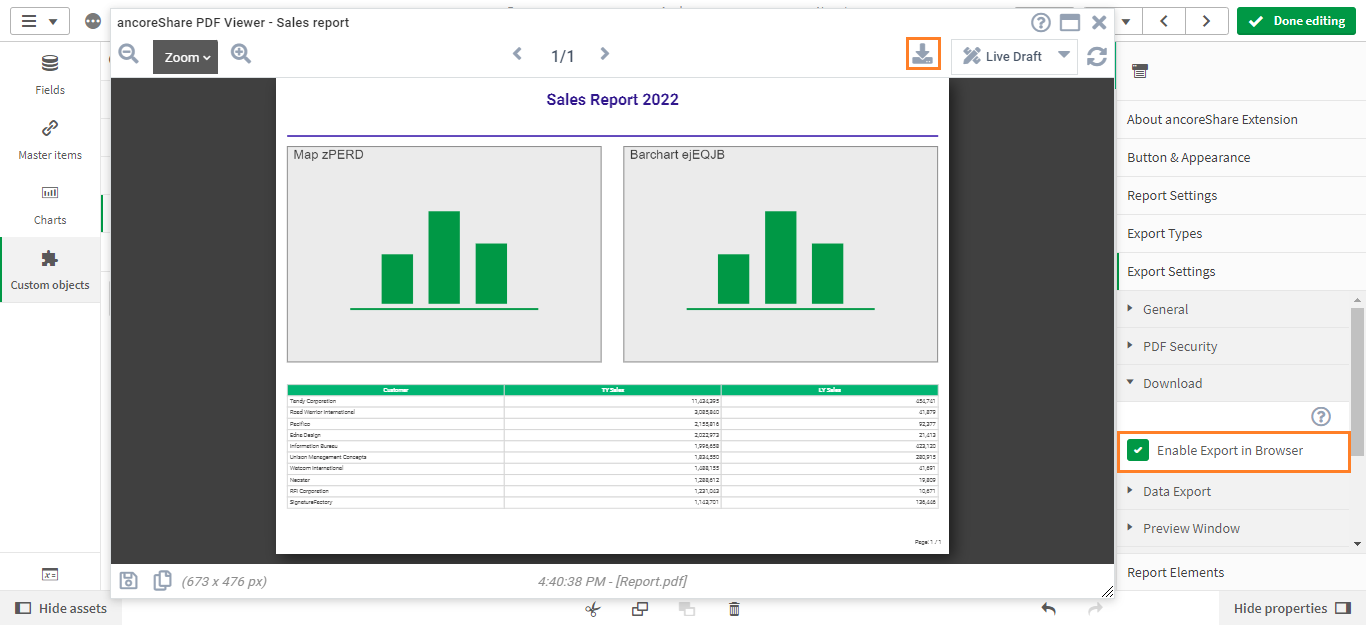
You can export and share your reports from the preview window if you have enabled the settings from the properties panel. If enabled, you can download your report, email it to the specified recipients or publish it to a Dropbox folder.
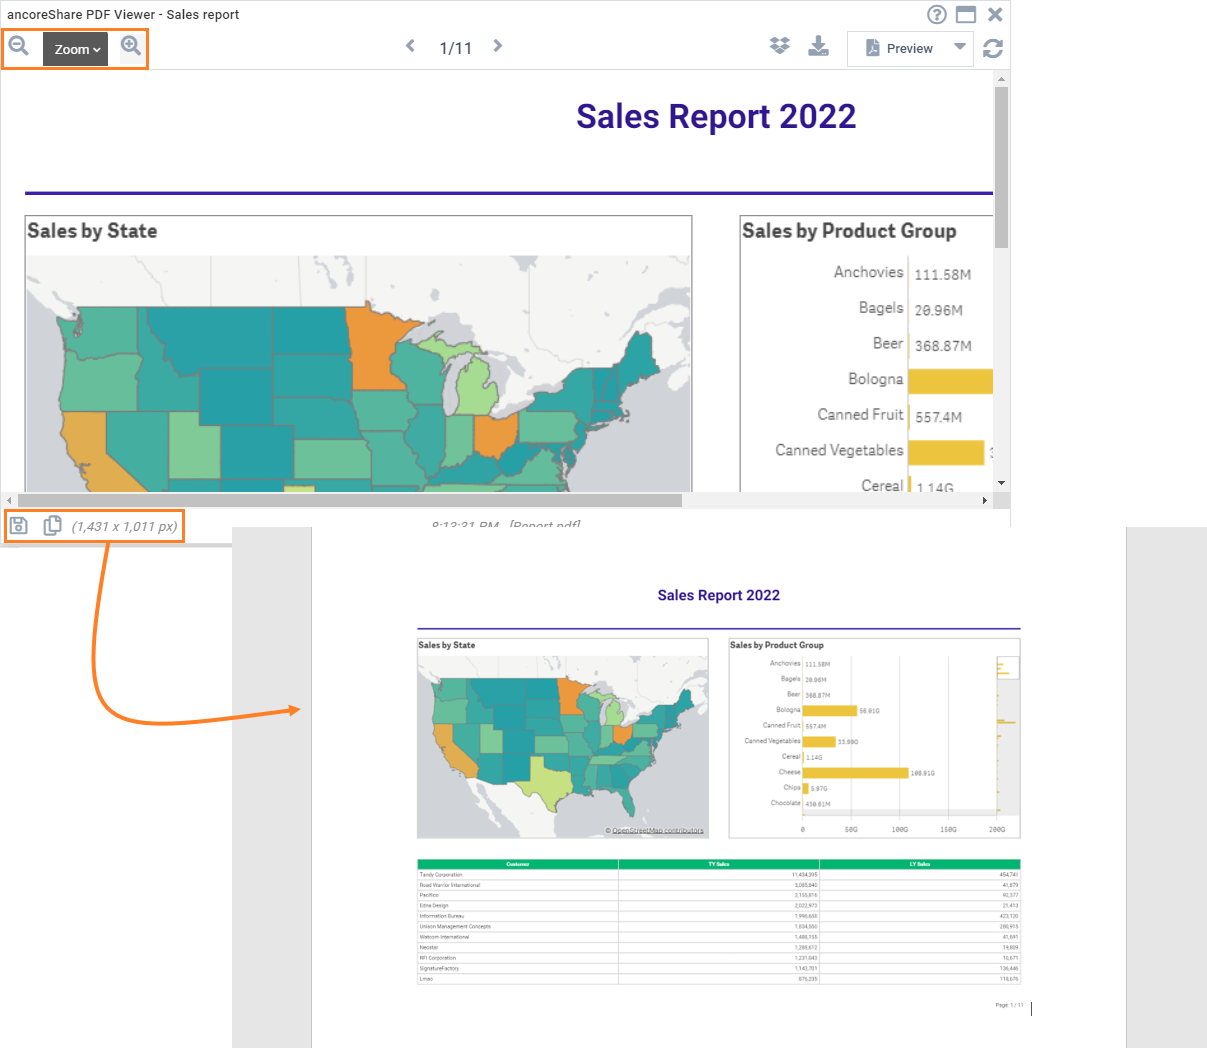
The two buttons in the bottom left corner also enable you to export the current report page as a PNG image - either download the page as image file or copy it directly to your clipboard.
Download
If you have selected the Enable Export in Browser option from the Export Settings, you will see a download icon in the report header, as shown in the following image.
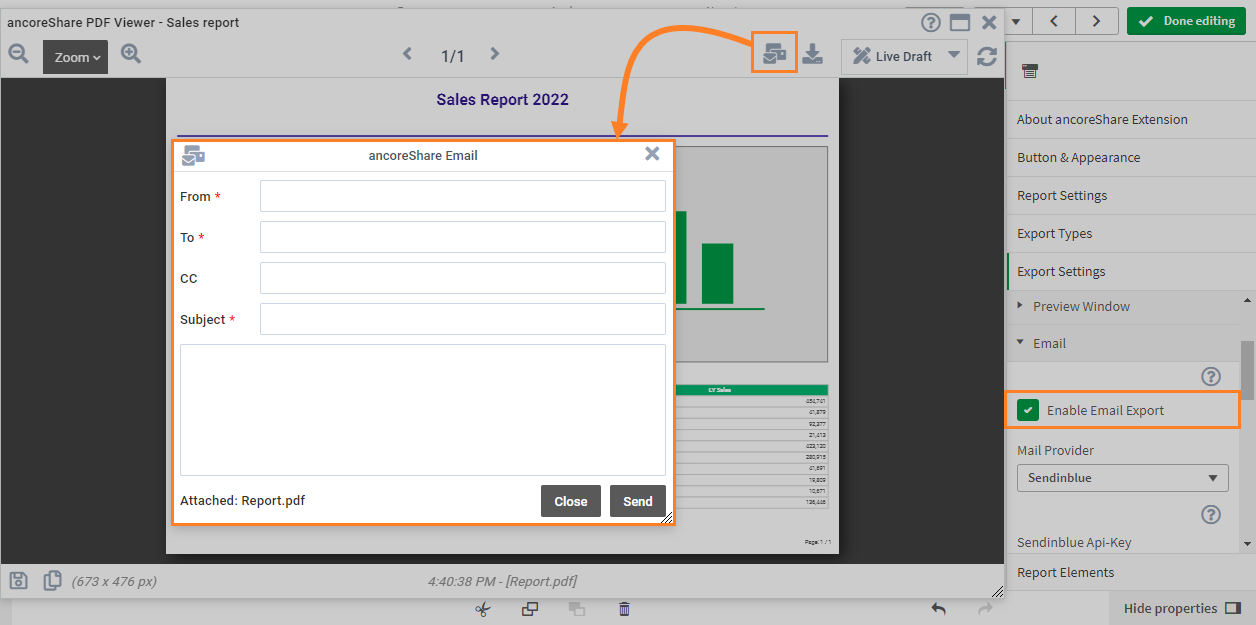
If you have enabled the Show Email Dialog box from the Export Settings, you will see an email icon in the report header. Use it to see the email dialog box. You can edit your email settings from here.
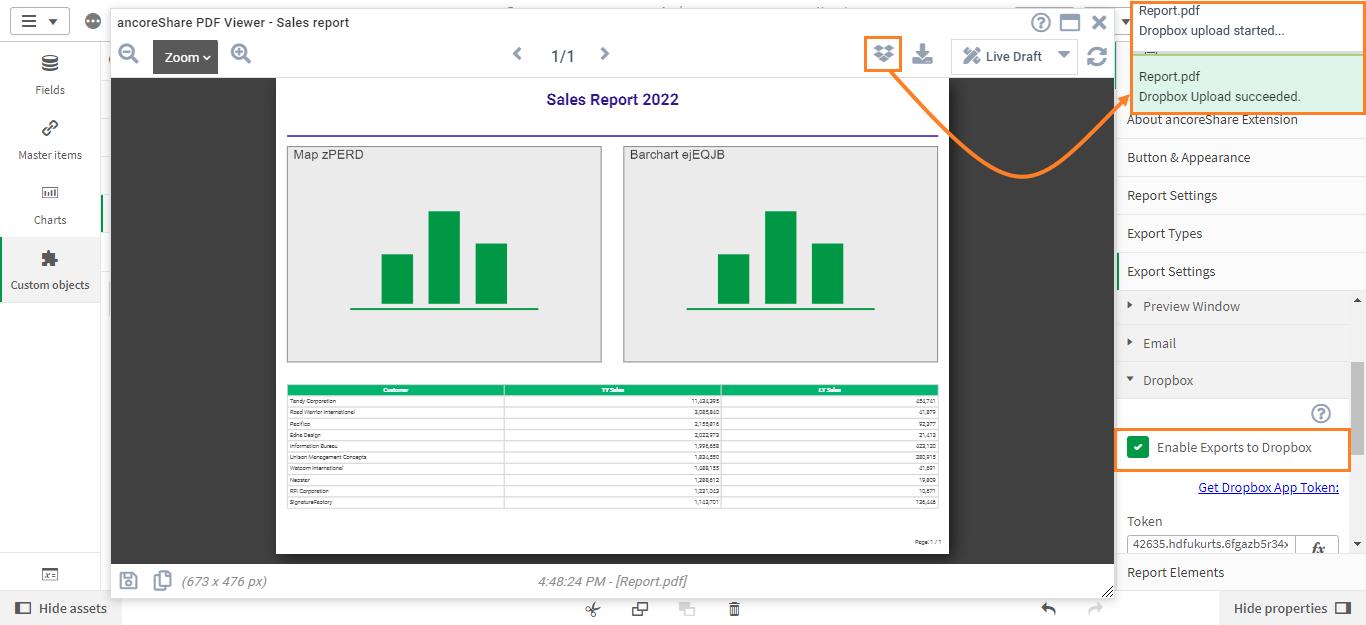
Dropbox
If you have selected the Enable Export to Dropbox option, you will see the Dropbox icon in the preview window. You can use this to upload the report to your Dropbox folder quickly. You will see status messages when the upload starts and succeeds.
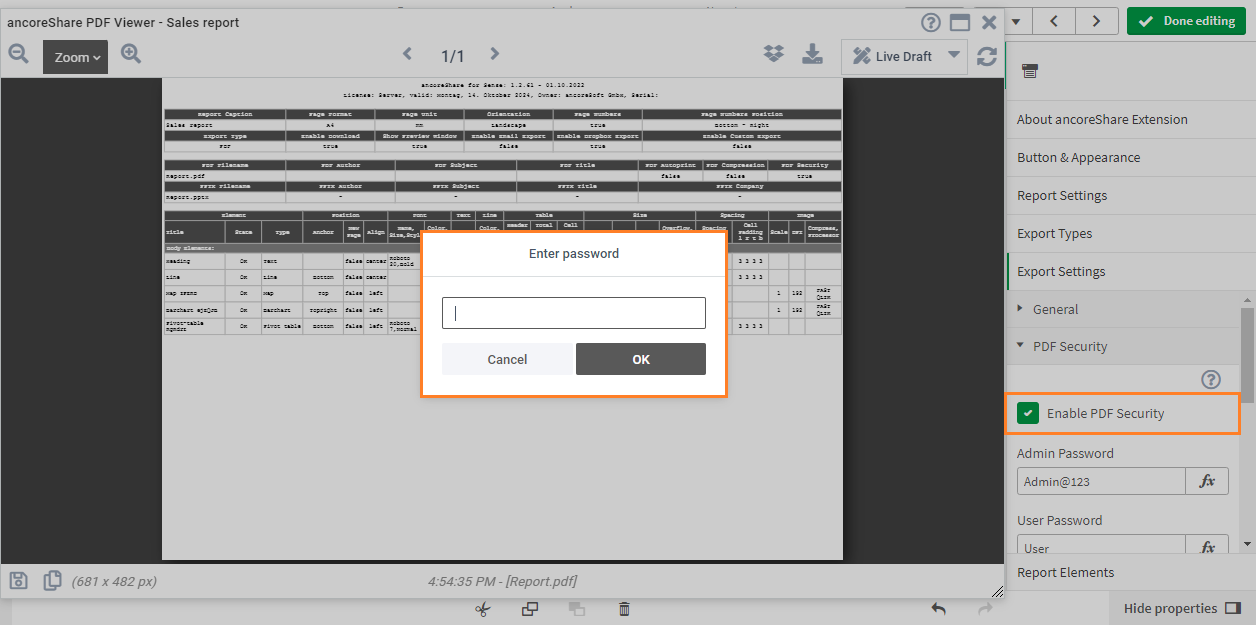
PDF security
If PDF Security is enabled, the preview window will also require you to provide the password to see previews. It provides a good way for the designer to check how the passwords are working.
Page as image
Using the Download and Copy page options, you can download and save or just copy the current page displayed in the preview window as a PNG image.
Note that only the current page in the view in the preview window is copied or downloaded. Use the arrows on the top to navigate through pages and save or copy them as images individually.
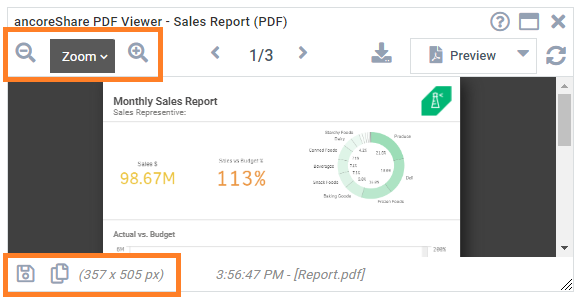
The brackets right to the PNG buttons show the current image size in pixels. By zooming in, the size increases and by zooming out the image gets smaller. This way you can create anything from a small thumbnail up to a high-resolution image for every possible use case.
Here are some reference sizes (rounded):
| Type | Pixels | Millimeters | Inches |
|---|---|---|---|
| DIN A4 | 794 x 1123 | 210 x 297 | 8.3 x 11.7 |
| Letter | 816 x 1056 | 216 x 279 | 8.5 x 11 |
| 16:9 PPTX* | 1920 x 1080 | 254 x 143 | 10 x 5.6 |
| Email Body | 1000 x 600 | 265 x 159 | 10.4 x 6.3 |
*Numbers in millimeters and inch according to MS PowerPoint format "On-screen Show (16:9)
The default screen resolution an all electronic devices is always 96 dpi and taking a simple screenshot from your Sense sheet will therefore always be at 96 dpi. But you can't control the size of the image this way. Whereas generating a very large sized image and scaling it back to a smaller display afterwards enables high-resolution image quality.
By utilizing this ancoreShare imge feature you can also combine several charts and details from various places on one image rather than collecting several pieces individually.
Watch this video to see how it's done: youtube.com | Clipboard support for images in Qlik Sense
Copy to clipboard
Clicking the Copy icon (right) copies the image to your clipboard.
You can paste the copied image anywhere, such as into an email or on a PowerPoint slide.
By pressing the Windows key + V (instead of regular Ctrl + V for pasting), you enable the Windows clipboard history manager, which allows to access clipboard history and thereby pasting multiple copied content pieces, such as multiple report page images. Press Windows + V once to enable this functionality and then go to your report and copy each needed page with Ctrl + C. Afterwards you can switch to your other application and by pressing again Windows +V you can now paste all the previously copied pages one by one to your document, slide, or email, without having to constantly switch between applications.
Here's a screenshot showing a page copied from the Preview window and pasted into a Word document.
Download as image file
Clicking the Download icon (left) downloads the report page as a PNG image file.
The name of the image file consist of the PDF report name in Export Type settings plus "page" and the current page number.
For example: "My Report-page-3.png"
Next Steps:
- Now start designing report content
- Learn more about positioning all elements
- Or, share and export the report