Intro
Design pixel-perfect reports based on all the data available in your Qlik environment with anoreShare!
|
|
Using ancoreShare Server, you can quickly extract, organize, and prepare your data to create engaging reports. With an intuitive drag and drop interface, you get complete flexibility to design your reports, just the way you want them to be.
As ancoreShare supports all Sense Visualizations and also most third-party extensions, you can add any Qlik visualization like bar charts, scatter plots, maps, KPI charts, gauges, combo charts, filter panels, or pivot tables to your report using simple drag and drop operations.
Besides this, you can add your Qlik tables, as true data-driven tables with selectable text content, and not limited to just an image of the table. For better structures and layouts, you can use text elements, lines, and rectangles too!
Workflow
We recommend you read the following sections before you start designing your reports.
Here's the workflow to help you design and share your reports with ancoreShare Server:
| STEP 1 | STEP 2 | STEP 3 | STEP 4 |
| Create Environment | Basic Settings | Design Content and Collaborate | Generate Report |
| Create a Report Connect Sources Manage Access | Report Settings Page Settings | Add Elements: Charts and Visualizations Tables and Pivot Tables Text Elements Lines and Rectangles And Specify Data with Filters and Page Cycle | Export Formats Export directly from Designer Publish for Jobs |
Navigation
Navigate through this section - follow the flow and design your report step by step:
| Article | What to expect |
| Create Report | Start by creating a new report record, connect it with sources and restrict access. |
| Designer Interface | Enter the Designer - showing you around. |
| Import and Export Report | Optionally, transfer reports between separate ancoreShare instances, or start from scratch in the next step. |
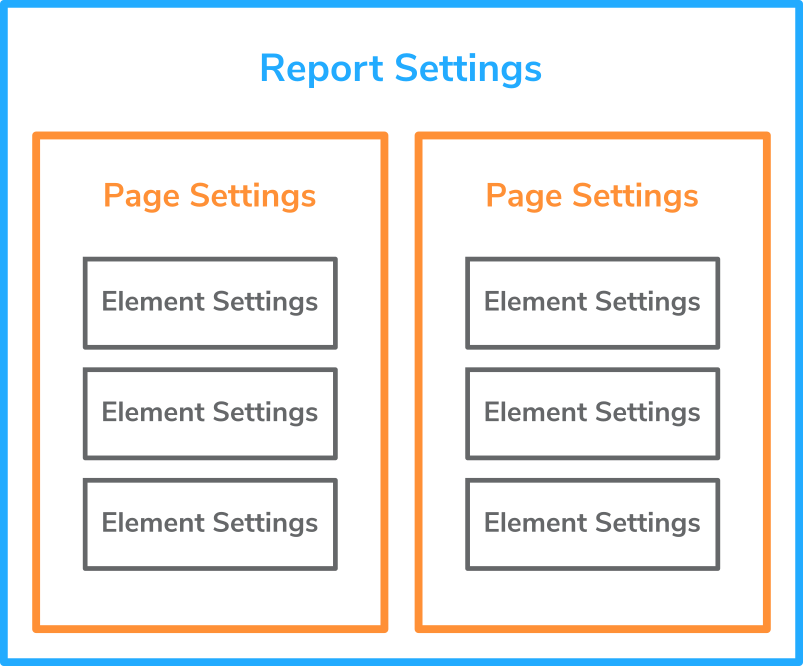
| Report Settings | Make global settings for your report. |
| Page Settings | Individual settings per report page, set a page cycle, or work with PowerPoint and Excel Templates. |
| Elements Settings | Set all the details for each of your elements: |
| Filtering Data | Filter the data for the content of your objects on multiple levels - all fully dynamically, as you know it from Qlik. |
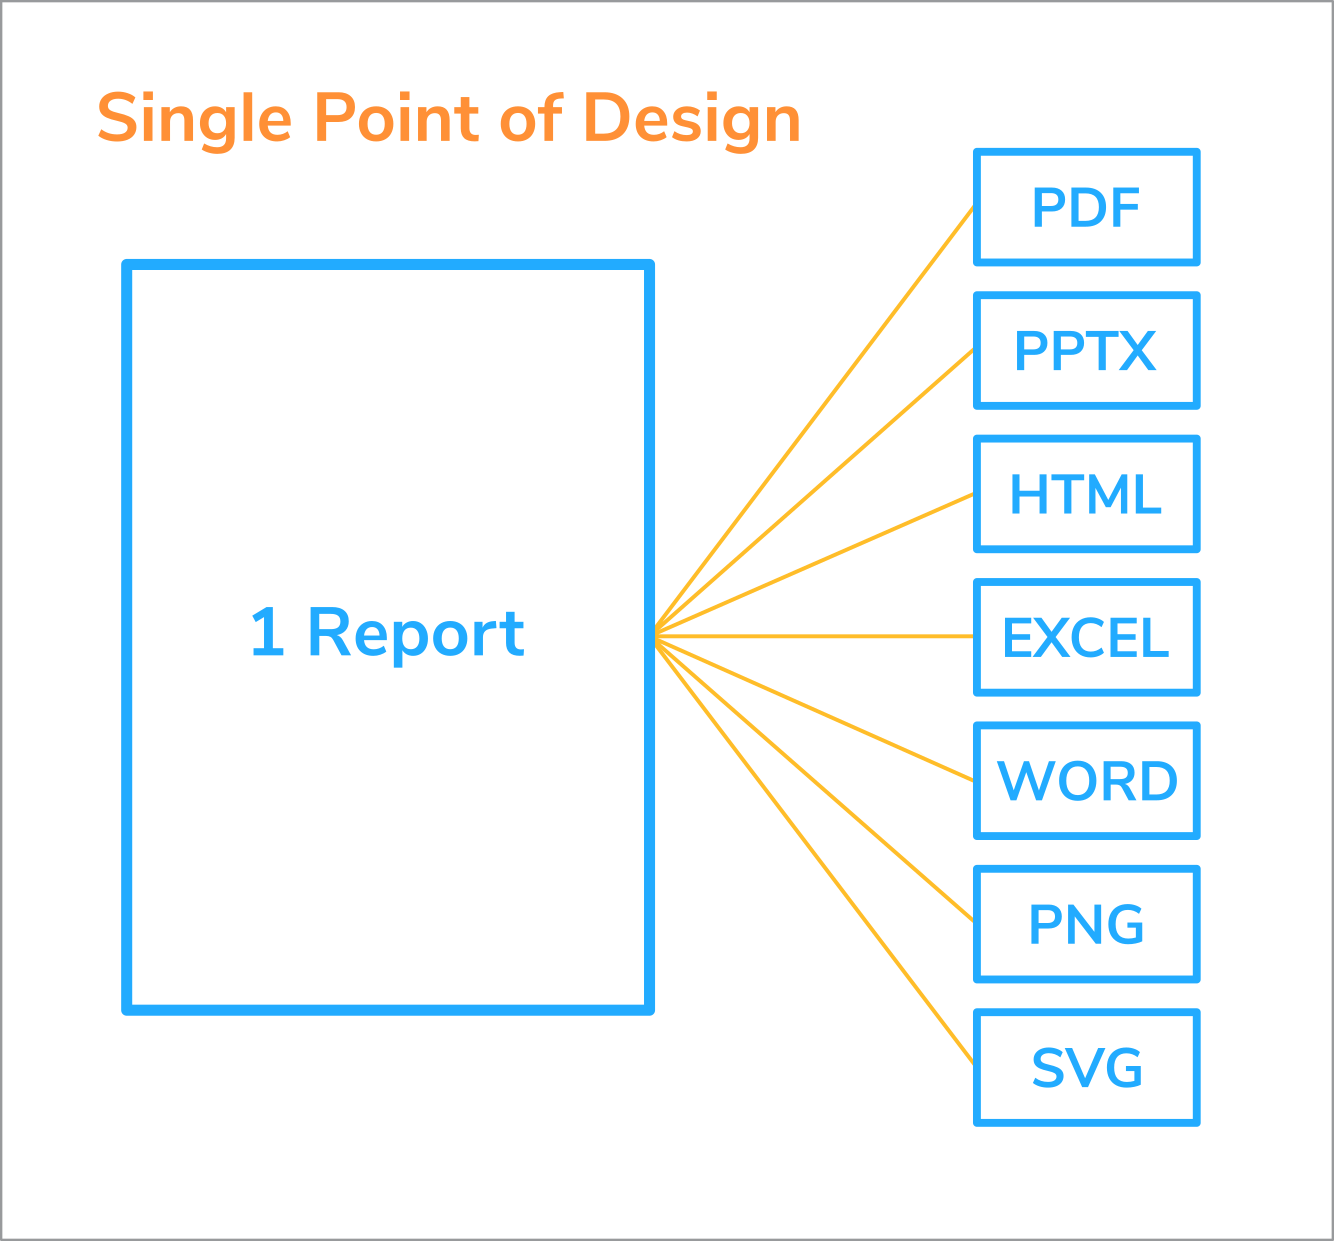
| Export Formats | Just one report makes all the various export formats - learn what to keep in mind there. |
| Export from Designer | While working on your report you can generate exports in all formats directly in the Designer and see how it turns out. |
Settings
The following image explains how the settings interact.
Export Formats
Once you have created your design, you can export the report in any of the supported formats to see how the settings would render your report. As you can see in the image below, you can generate seven different export formats from a single ancoreShare report, just with one click.
When your report is ready to be shared, proceed to create a Job that automatically generates, exports, and distributes it by the scheduler or via alerting conditions.
You can also provide On Demand access to the reports, which allows users to manually generate their exports from your report.
Next Steps
- Create your first report
- Get to know the Interface
- Start designing