Intro
You can customize and style your reports according to your organizational requirements by adding multiple elements from data and visualizations in your Qlik applications.
ancoreShare Server gives you the flexibility to add Qlik objects from multiple sources, text elements, lines, and rectangles to your report. ancoreShare also supports all the different visualizations available in Qlik Sense and QlikView, and other integrated Qlik extensions. Further, you can add existing elements from the same page, from a different page in the same report, or even from a separate report using the pasting tools or hotkeys.
This section provides information on adding elements to your report and working with them to define basic settings.
- Element types
- Basic element properties
- Working with elements - add, copy, paste, arrange, align, delete, and lock
Element typesancoreShare allows you to add the following types:
| .png) |
Element properties
Using the element-specific settings, you can customize how the element is rendered on your report.
The intuitive WYSIWYG report designer lets you position and resize the elements using simple mouse operations. For further precision and to quickly generate pixel-perfect reports, you can use the options on the Settings bar.
The following image shows the properties available on the Settings bar for various elements.
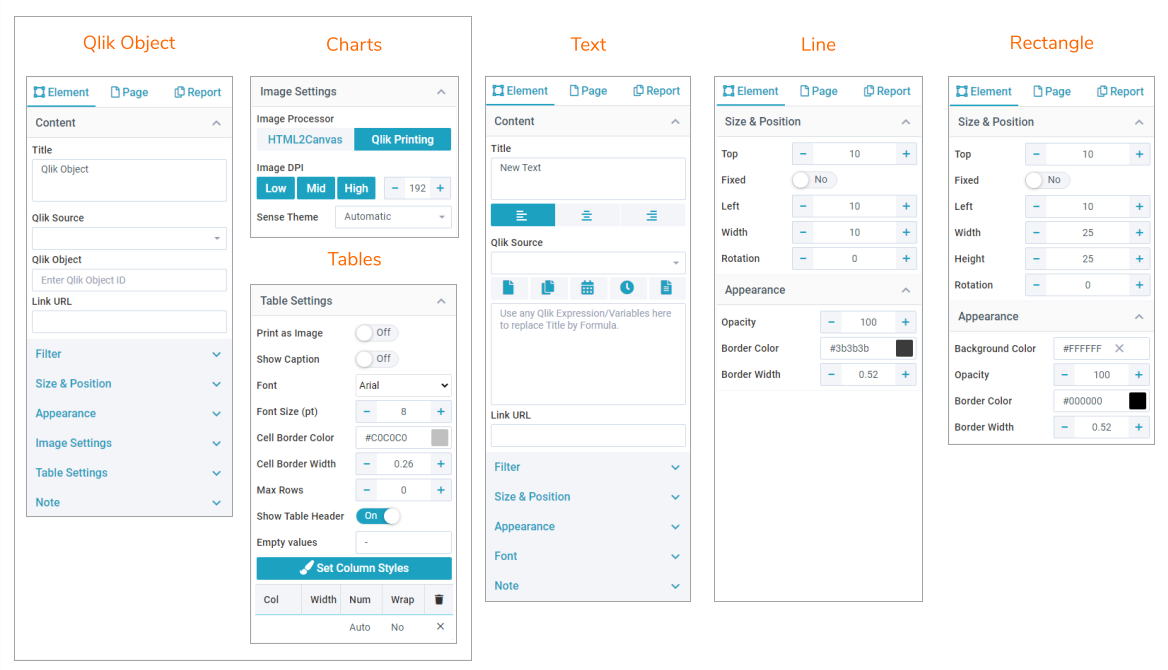
By default, chart-specific properties are displayed when you drop a Qlik Object on the designer sheet. The Table-specific properties are respected when you select and add a table from the Qlik Source.
Working with elements
For ease of use, you can drag and drop elements on the designer page and reorder them at any time to change the report design.
You can also copy multiple elements and their properties across reports and designer pages. For example, you may want to use the same text element for header or footer for all your reports, the same style of tables across multiple reports, or the complete design of one report as a template for other reports. You can quickly copy and paste the same elements across various reports or report designer pages in all such cases.
AddTo add any new element to your report, drag the corresponding icon onto your report page. | 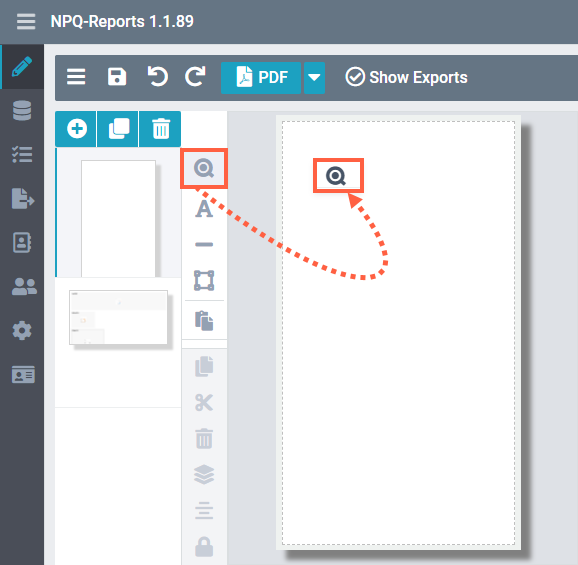 |
Copy and cutTo create a copy of any element, select the element and click the Copy button. To cut an element from your designer page, select the element, and click the Cut button. TIP: You can copy and cut elements from one report and paste them onto other reports! The element is copied/cut along with the properties defined for it. | 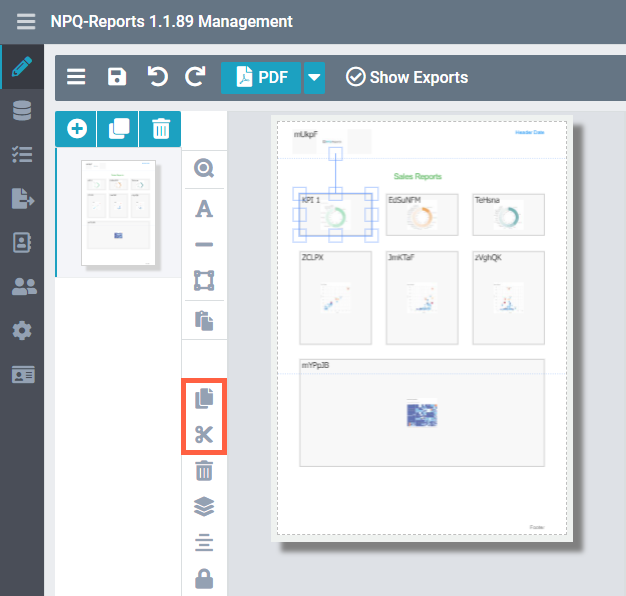 |
PasteTo paste one or multiple elements from your ancoreShare Server Designer clipboard, either:
Note Using Ctrl+V keys or clicking the paste button positions the copied elements at the exact same position when you copy the element across pages or reports. | .png) |
DeleteAt any time, you can select elements and click the Delete button or the Delete key on your keyboard to delete them. | .png) |
ArrangeThis option allows you to layer the elements, one atop another, in a single report. If elements overlap, layering determines which element is in the forefront and which one is in the background. Select the element for which you want to specify the layer, and select the appropriate option from:
For example, you can add a custom text title to your Qlik object using the layering options. As shown in the figure here, we added a text element with Blue text and selected the layering option as Bring to Top so that the text is displayed over the Qlik chart. Viewing hidden elements When elements are placed in layers, hiding the elements underneath, you can see and grab them from the objects list using the Page Settings > Objects options. | .png) Example Example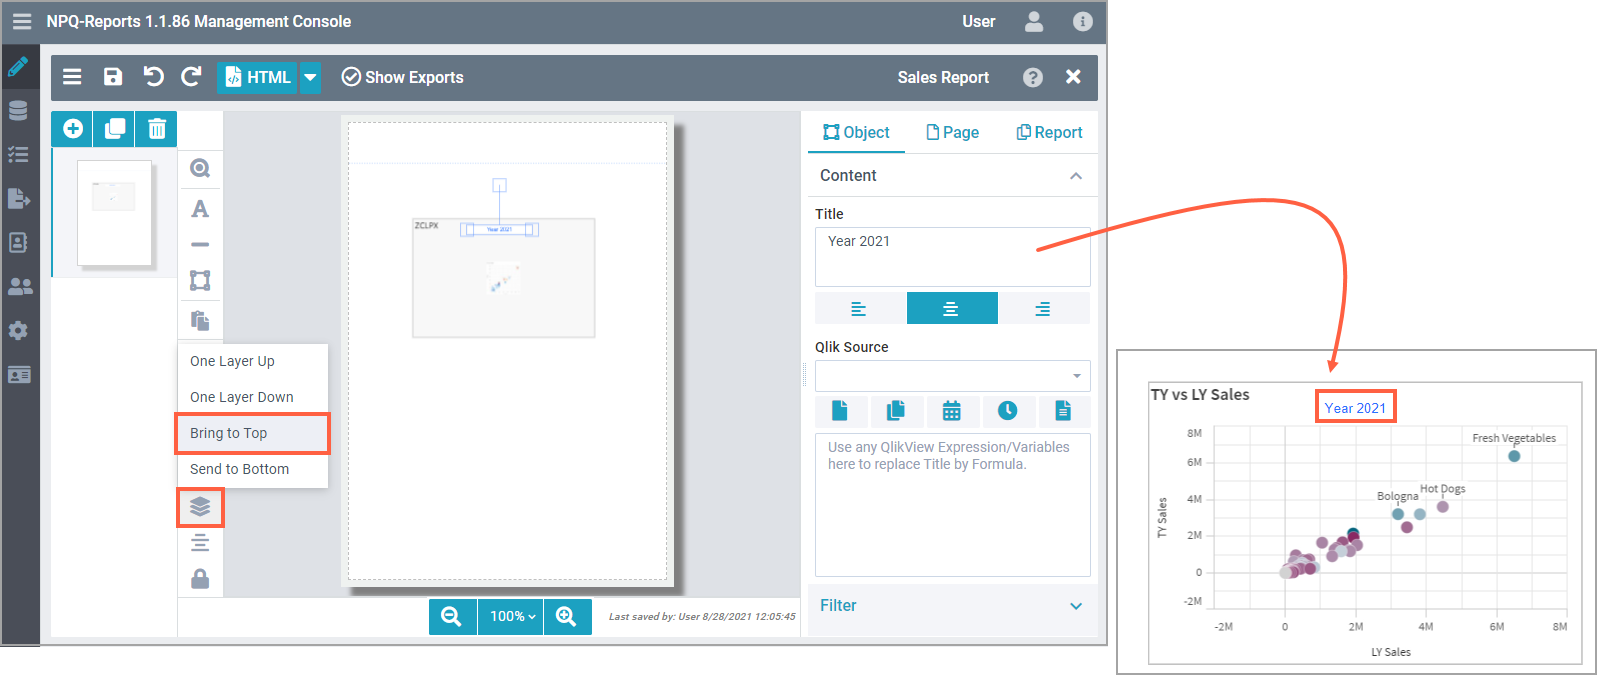 |
AlignUsing this option, you can specify the position of the elements on the page. Though you can quickly drag and drop the elements on your report wherever you like, using the options here ensures pixel-perfect alignment of all elements with respect to the page margins. To specify the position, select the element, click the Align button to choose the vertical and horizontal alignment position from Left, Center, Right, Top, Middle, and Bottom. When you drag elements on the designer to align them manually, you will see Green guidelines (shown in the image) to help you in perfect alignment. The Grid Snap Size specified in the Report Settings > Layout helps to automatically align objects on your designer page along perfect horizontal and vertical lines. | .png) 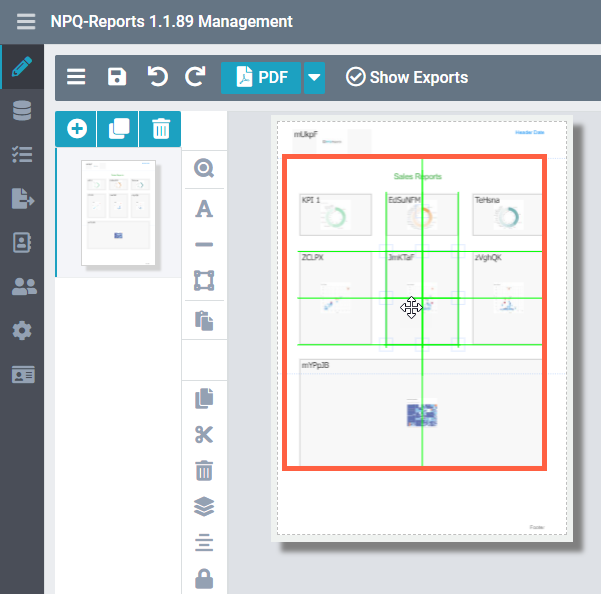 |
LockUsing this option, you can lock the element to restrict its movement. This is particularly helpful while working on a shared report where multiple users are editing it as it prevents any accidental movement elements.To lock an element, select it and click the Lock icon. Note Locking options restricts movement only on the designer and not on the export. It cannot prevent shifting of elements caused by true tables in report export. To lock the position of an element on the export, use the Fixed option under Size and Position on the Elements Settings | .png) |
Next Steps:
You can now proceed to configure properties for different element types: