Styling Columns
  • 29 Jan 2023
  • 7 Minutes to read
  • Dark
    Light

Styling Columns

  • Dark
    Light

Article summary

Intro

ancoreShare Extension allows you to configure condition-based and flexible styling formats for your true-table object. You can specify colors, font styles and alignment for each column in the table and set conditions or Qlik Expressions to further define styles for specific cells.

Order of styles
  • The style settings in the column style editor override the general Table settings specified in the properties panel.
  • Styles within the column style editor are respected in order of precedence from top to bottom - last one rules.
  • Checkboxes allow to NOT set a style and therefore preserve from the preceding settings.

For example, In style 1 if you have specified all sales totals under 5 Million should be filled with Red. After that, if you add a style 2 with the condition stating sales totals column should be filled in Green, then the table will respect style 2, and sales totals cells will be filled in Green even if the totals are less than 5 Million.

Now, let's see how you can work with column styling.

The following section will explain:
Tipp
While working on column styling, use the pin icon to open the Preview Window and click refresh to see a draft of your report with applied styles.
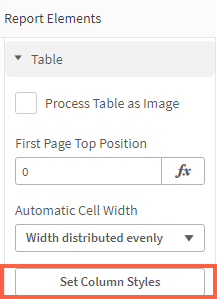
To specify conditions that will govern the table headers, totals rows, or columns, click the Set Column Styles button in Table settings.
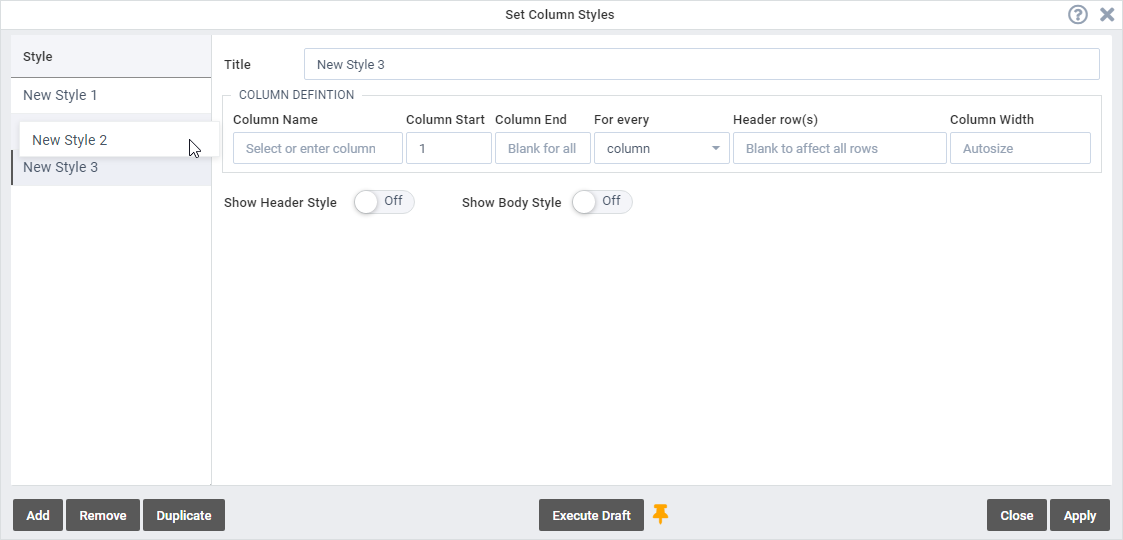
This opens the Set Column Styles dialog box.

Add Column Style

To access the editor and specify conditions that will govern the table headers, totals rows, or columns, click the Set Column Styles button in Table Settings.

  1. To add a new style, click the Add button from the bottom left of the dialog box. The fields on the dialog box are activated.
  2. Drag and drop the style in the Style pane on the left to change their order.
  3. In the Title field, provide a name for the style that will help you identify it.


Note
The order of adding styles is important as the styles are respected in order of precedence.


Column Definition

Specify the column(s) on which the added style should be applied. You can either go by column name for one column or by column number for one or more columns.
This section also allows you to set a specific width for the specified columns.

Column Name

Provide the column name on which you want to apply the style. Alternatively, start the name with "=" to provide a Qlik expression. This enables you to also work with dynamic dimensions or to control the column for which you create this style, for example, with a Sense Variable input object.

The column names are the same as those in your Sense App. If you provide a column name, the other fields for column numbers mentioned below are hidden, as you are defining the style for this particular column.

Refer to the Qlik documentation to know more about expressions.

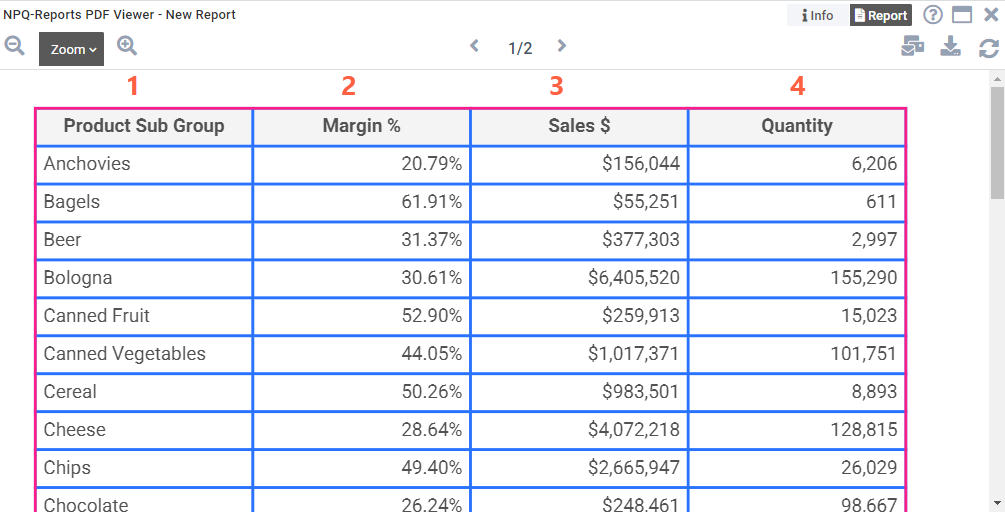
Column Numbers
  • Column Start:
    Number value, at which the style begins in the table.
  • Column End (optionally):
    Number value, with which the style ends in the table. If left blank, all the columns till the end of the table will follow the style.

See the example on the right showing column numbers.

  • For every (optionally):
    Choose the repetition that should follow the style, such as every column, or just every second column, third column, and so on. 
  • Header rows (optionally): 
    Here specify a comma-separated list of one or more header row numbers on which the style will be applied. If left blank, all the header rows will follow the style.
Column Width
Use this field to specify the column width. By default, the width is set to Autosize.
If specified, the number is calculated in the Report Unit set in the Page Settings (default is mm).

Header Style

To define a style for headers, toggle to enable the Show header style option, and specify:

  • Font and Fill Color: Use the color picker to select the font and fill colors for data in the header, or provide the color in the HEX code.
  • Alignment: Select the horizontal and vertical alignment of the header content.
  • Font Style: Choose formats like bold or italic.


Body style

To define a style for table cells, toggle to enable the Show body style option.
The Column Body Style area allows you to further target the style to certain rows or even specific cells based on conditional values or a Qlik expression.

Specify rows
  • Type:
    Choose whether the cell contains text or an image.
  • Valid For:
    Choose whether you want to apply the condition on All Values, Total Values, or Non Total Values.
  • Condition: 
    Select the kind of condition from the list.
    The characters apply to numeric values - e.g. "!=" (is not), or ">=" (greater as or equal).
    The names apply to text values - e.g. "Begins with", or "Contains".
  • Condition Value or Expression:
    Specify one or multiple value or expression for fulfilling the condition. The style will be applied to the cells that meet this condition. You can specify the condition as a Qlik Expression too (refer to the Qlik documentation to know more about expressions).
    Separate multiple values with || (two pipe characters), they will be applied by OR logic.
  • Row Condition:
    You can choose which rows will follow the condition. You can select All, Even (2nd, 4th, 6th, and so on), or Odd (1st, 3rd, 5th, and so on) rows. 
Set style
  • Font and Fill Color: Use the color picker to select the font and fill colors for data in the header, or provide the color in the HEX code.
  • Alignment: Select the horizontal and vertical alignment of the header content.
    The body styling area has an auto-align option (the magic wand icon), which aligns text to the left and numeric values to the right.
  • Font Style: Choose formats like bold or italic.
Apply Styles To: Choose whether to apply the style only to the cells in the specified column(s) or to continue the style for the row to the right.
  • Columns: The style will be applied just to the column(s) that are specified in the Column Definition.
  • Row: The style will be applied to the cells in the specified column(s) and the entire row to the right of those cells where the condition applies.
Tipp
In case you have configured multiple styles, you can untick the checkbox corresponding to the properties that you want to be respected in the preceding styles.
For example: If you want only the body fill color to be changed for a specific condition while keeping the rest of the properties the same as the previous style. In this case, add a new style, select only the checkbox corresponding to the fill color and specify the color. This will ensure that the new style will respect all the other properties defined in the previous style, but with the new fill color.

Once you are done with setting your styles, click Apply.

Images in table cells

Qlik Sense tables (as well as some other third-party table objects like Vizlib tables) allow to display images in cells, either from a file or via HTML image URL source. (Go to Qlik help to learn more.)

To display the image values in ancoreShare as well, just set the cell Type to "Image" in the Body Style properties. 

The ancoreShare report respects the same image properties as specified in your Sense table object.

Adjust row height
The specified minimum row height effects the image size.
Go to the table properties and adjust the minimum row height to make enough space for the images, as the table row cannot adapt to the size of the images automatically. The minimum row height setting determins how big your images will be displayed in the table on your report.


Example

Let us look at an example for styling headers and columns to understand how it works.
Consider a Sales report where you want to highlight whether the sales target was achieved or not.

For this, let us assume that the sales target was $50 Billion.
Now, we can define two conditions. One for those who achieved the target and another for those who did not. You can define just one condition too, and the rest of the cells will follow the default styling.

Step 1 - Set the first style:

Let us first define a condition for the cells that meet the target.
Here, we can set the condition as Total Values >= 50000000000 and define a color scheme corresponding to it.
As you can see in the image, we have specified the fill color for all such columns as Green.


Step 1:


Step 2 - Set the second style:

Let us now define a condition for the cells that do not meet the target.

Click the Add button to add another condition.
Here, we can set the condition as Total Values < 50000000000 and define a color scheme corresponding to it.
As you can see in the image, we have specified the fill color for all such columns Red. Note that the checkboxes corresponding to all the other styles are not selected, as we want to inherit the styles defined in the preceding column style.


Step 2:


Result:

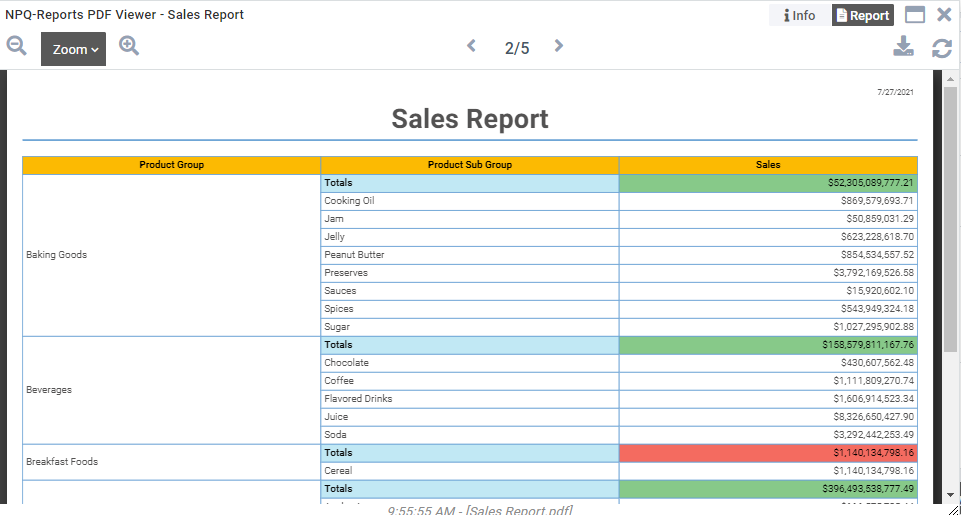
Here's a sample report showing how the conditions are applied to different column cells. As you can see, all the cells where totals exceed $5 Billion are highlighted in Green, and the ones having less than $5 Billion are highlighted in Red.

Similarly, you can define any style for your table.

Result:

You can now proceed to add other elements to your report.


Next Steps:


Was this article helpful?

What's Next