Intro
ancoreShare empowers you to design reports using all the data and visualizations from your Qlik App, across every sheet. With ancoreShare, you can quickly extract, organize, and prepare your visualizations, insights, and data to create compelling reports. Plus, it gives you the flexibility to fully customize and enhance your reports as needed.
You can incorporate any Qlik visualization into your report, including bar charts, scatter plots, maps, KPI charts, gauges, combo charts, filter panels, straight tables, or pivot tables. ancoreShare supports all Qlik Sense visualizations and most third-party extensions like Vizlib, Inphinity, and AnyChart. If a third-party extension isn’t supported out of the box, simply contact our support team, and we’ll make it work!
Before you start designing your report, make sure to add the ancoreShare button to your Qlik sheet. We recommend reviewing the relevant sections beforehand to familiarize yourself with the design process.
The report design section is divided into three main areas: |
|
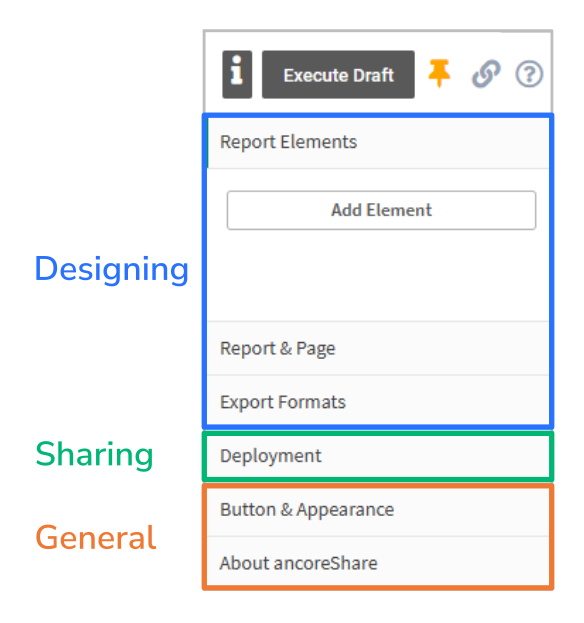
Report ElementsThis is where you add content to your report in the form of elements, such as Qlik objects, visualizations, entire sheets, text, titles, lines, a table of contents, or cycle elements to loop data through defined sets. Go to Report Elements to learn more. |  |
Report SettingsThis section includes global settings for your report, such as background execution options, security management, a condition that must be met before the report is generated, JavaScript events, and various settings for page format and footer page numbers. Go to Report Settings to learn more. | 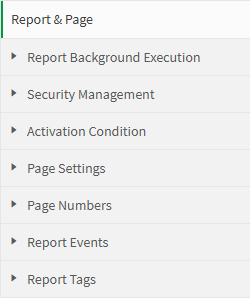 |
Export FormatsIn this section, you can first select the output format for your report, choosing between options like PDF, Excel, PowerPoint, Word, PNG, HTML, or CSV depending on your requirements. After selecting the format, you can configure specific settings for that format, such as file names, compression and security options for PDF, uploading an Excel template file, or defining a CSV delimiter. Go to Export Formats to learn more. |  |
Next Steps:
- Define report and page settings
- Add and configure report content with elements
- Set properties for specific export formats